blog
An Introduction to Database High Availability for MySQL & MariaDB

The following is an excerpt from our whitepaper “How to Design Highly Available Open Source Database Environments” which can be downloaded for free.
A Couple of Words on “High Availability”
These days high availability is a must for any serious deployment. Long gone are days when you could schedule a downtime of your database for several hours to perform a maintenance. If your services are not available, you are losing customers and money. Therefore making a database environment highly available has typically one of the highest priorities.
This poses a significant challenge to database administrators. First of all, how do you tell if your environment is highly available or not? How would you measure it? What are the steps you need to take in order to improve availability? How to design your setup to make it highly available from the beginning?
There are many many HA solutions available in the MySQL (and MariaDB) ecosystem, but how do we know which ones we can trust? Some solutions might work under certain specific conditions, but might cause more trouble when applied outside of these conditions. Even a basic functionality like MySQL replication, which can be configured in many ways, can cause significant harm – for instance, circular replication with multiple writeable masters. Although it is easy to set up a ‘multi-master setup’ using replication, it can very easily break and leave us with diverging datasets on different servers. For a database, which is often considered the single source of truth, compromised data integrity can have catastrophic consequences.
In the following chapters, we’ll discuss the requirements for high availability in database
setups, and how to design the system from the ground up.
Measuring High Availability
What is high availability? To be able to decide if a given environment is highly available or not, one has to have some metrics for that. There are numerous ways you can measure high availability, we’ll focus on some of the most basic stuff.
First, though, let’s think what this whole high availability is all about? What is its purpose? It is about making sure your environment serves its purpose. Purpose can be defined in many ways but, typically, it will be about delivering some service. In the database world, typically it’s somewhat related to data. It could be serving data to your internal application. It can be to store data and make it queryable by analytical processes. It can be to store some data for your users, and provide it when requested on demand. Once we are clear about the purpose, we can establish the success factors involved. This will help us define what high availability means in our specific case.
SLA’s
Service Level Agreement (SLA). It is also quite common to define SLA’s for internal services. What is an SLA? It is a definition of the service level you plan to provide to your customers. This is for them to better understand what level of stability you plan for a service they bought or are planning to buy. There are numerous methods you can leverage to prepare a SLA but typical ones are:
- Availability of the service (percent)
- Responsiveness of the service – latency (average, max, 95 percentile, 99 percentile)
- Packet loss over the network (percent)
- Throughput (average, minimum, 95 percentile, 99 percentile)
It can get more complex than that, though. In a sharded, multi-user environment you can define, let’s say, your SLA as: “Service will be available 99,99% of the time, downtime is declared when more than 2% of the users is affected. No incident can take more than 15 minutes to be resolved”. Such SLA can also be extended to incorporate query response time: “downtime is called if 99 percentile of latency for queries excede 200 milliseconds”.
Nines
Availability is typically measured in “nines”, let us look into what exactly a given amount of “nines” guarantees. The table below is taken from Wikipedia:
| Availability % | Downtime per year | Downtime per month | Downtime per week | Downtime per day |
|---|---|---|---|---|
| 90% (“one nine”) |
36.5 days | 72 hours | 16.8 hours | 2.4 hours |
| 95% (“one and a half nines”) |
18.25 days | 36 hours | 8.4 hours | 1.2 hours |
| 97% | 10.96 days | 21.6 hours | 5.04 hours | 43.2 min |
| 98% | 7.30 days | 14.4 hours | 3.36 hours | 28.8 min |
| 99% (“two nines”) |
3.65 days | 7.20 hours | 1.68 hours | 14.4 min |
| 99.5% (“two and a half nines”) |
1.83 days | 3.60 hours | 50.4 min | 7.2 min |
| 99.8% | 17.52 hours | 86.23 min | 20.16 min | 2.88 min |
| 99.9% (“three nines”) |
8.76 hours | 43.8 min | 10.1 min | 1.44 min |
| 99.95% (“three and a half nines”) |
4.38 hours | 21.56 min | 5.04 min | 43.2 s |
| 99.99% (“four nines”) |
52.56 min | 4.38 min | 1.01 min | 8.64 s |
| 99.995% (“four and a half nines”) |
26.28 min | 2.16 min | 30.24 s | 4.32 s |
| 99.999% (“five nines”) |
5.26 min | 25.9 s | 6.05 s | 864.3 ms |
| 99.9999% (“six nines”) |
31.5 s | 2.59 s | 604.8 ms | 86.4 ms |
| 99.99999% (“seven nines”) |
3.15 s | 262.97 ms | 60.48 ms | 8.64 ms |
| 99.999999% (“eight nines”) |
315.569 ms | 26.297 ms | 6.048 ms | 0.864 ms |
| 99.9999999% (“nine nines”) |
31.5569 ms | 2.6297 ms | 0.6048 ms | 0.0864 ms |
As we can see, it escalates quickly. Five nines (99,999% availability) is equivalent to 5.26 minutes of downtime over the course of a year. Availability can also be calculated in different, smaller ranges: per month, per week, per day. Keep in mind those numbers, as they will be useful when we start to discuss the costs associated with maintaining different levels of availability.
Measuring Availability
To tell if there is a downtime or not, one has to have insight into the environment. You need to track the metrics which define the availability of your systems. It is important to keep in mind that you should measure it from a customer’s point of view, taking the broader picture under consideration. It doesn’t matter if your databases are up if, let’s say, due to a network issue, no application cannot reach them. Every single building block of your setup has its impact on availability.
One of the good places where to look for availability data is web server logs. All requests which ended up with errors mean something has happened. It could be HTTP error 500 returned by the application, because the database connection failed. Those could be programmatic errors pointing to some database issues, and which ended up in Apache’s error log. You can also use simple metric as uptime of database servers, although, with more complex SLA’s it might be tricky to determine how the unavailability of one database impacted your user base. No matter what you do, you should use more than one metric – this is needed to capture issues which might have happened on different layers of your environment.
Magic Number: “Three”
Even though high availability is also about redundancy, in case of database clusters, three is a magic number. It is not enough to have two nodes for redundancy – such setup does not provide any built-in high availability. Sure, it might be better than just a single node, but human intervention is required to recover services. Let’s see why it is so.

Let’s assume we have two nodes, A and B. There’s a network link between them. Let us assume that both A and B serves writes and the application randomly picks where to connect (which means that part of the application will connect to node A and the other part will connect to node B). Now, let’s imagine we have a network issue which results in lost network connectivity between A and B.
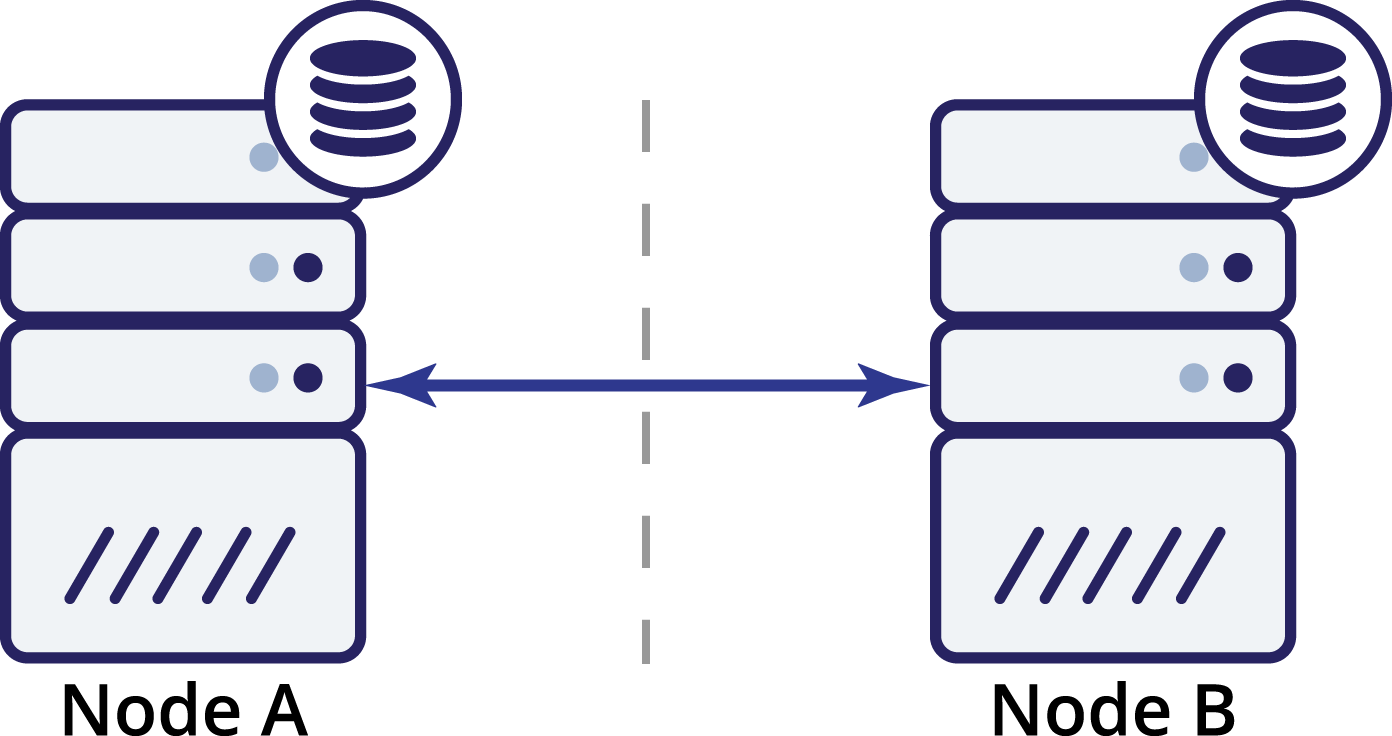
What now? Neither A nor B can know the state of the other node. There are two actions which can be taken by both nodes:
- They can continue accepting traffic
- They can cease to operate and refuse to serve any traffic
Let’s think about the first option. As long as the other node is indeed down, this is the preferred action to take – we want our database to continue serving traffic. This is the main idea behind high availability after all. What would happen, though, if both nodes would continue to accept traffic while being disconnected from each other? New data will be added on both sides, and the datasets will get out of sync. When the network issue will be resolved, it will be a daunting task to merge those two datasets. Therefore, it is not acceptable to keep both nodes up and running. The problem is – how can node A tell if node B is alive or not (and vice versa)? The answer is – it cannot. If all connectivity is down, there is no way to distinguish a failed node from a failed network. As a result, the only safe action is for both nodes to cease all operations and refuse to
serve traffic.
Let’s think now how a third node can help us in such a situation.
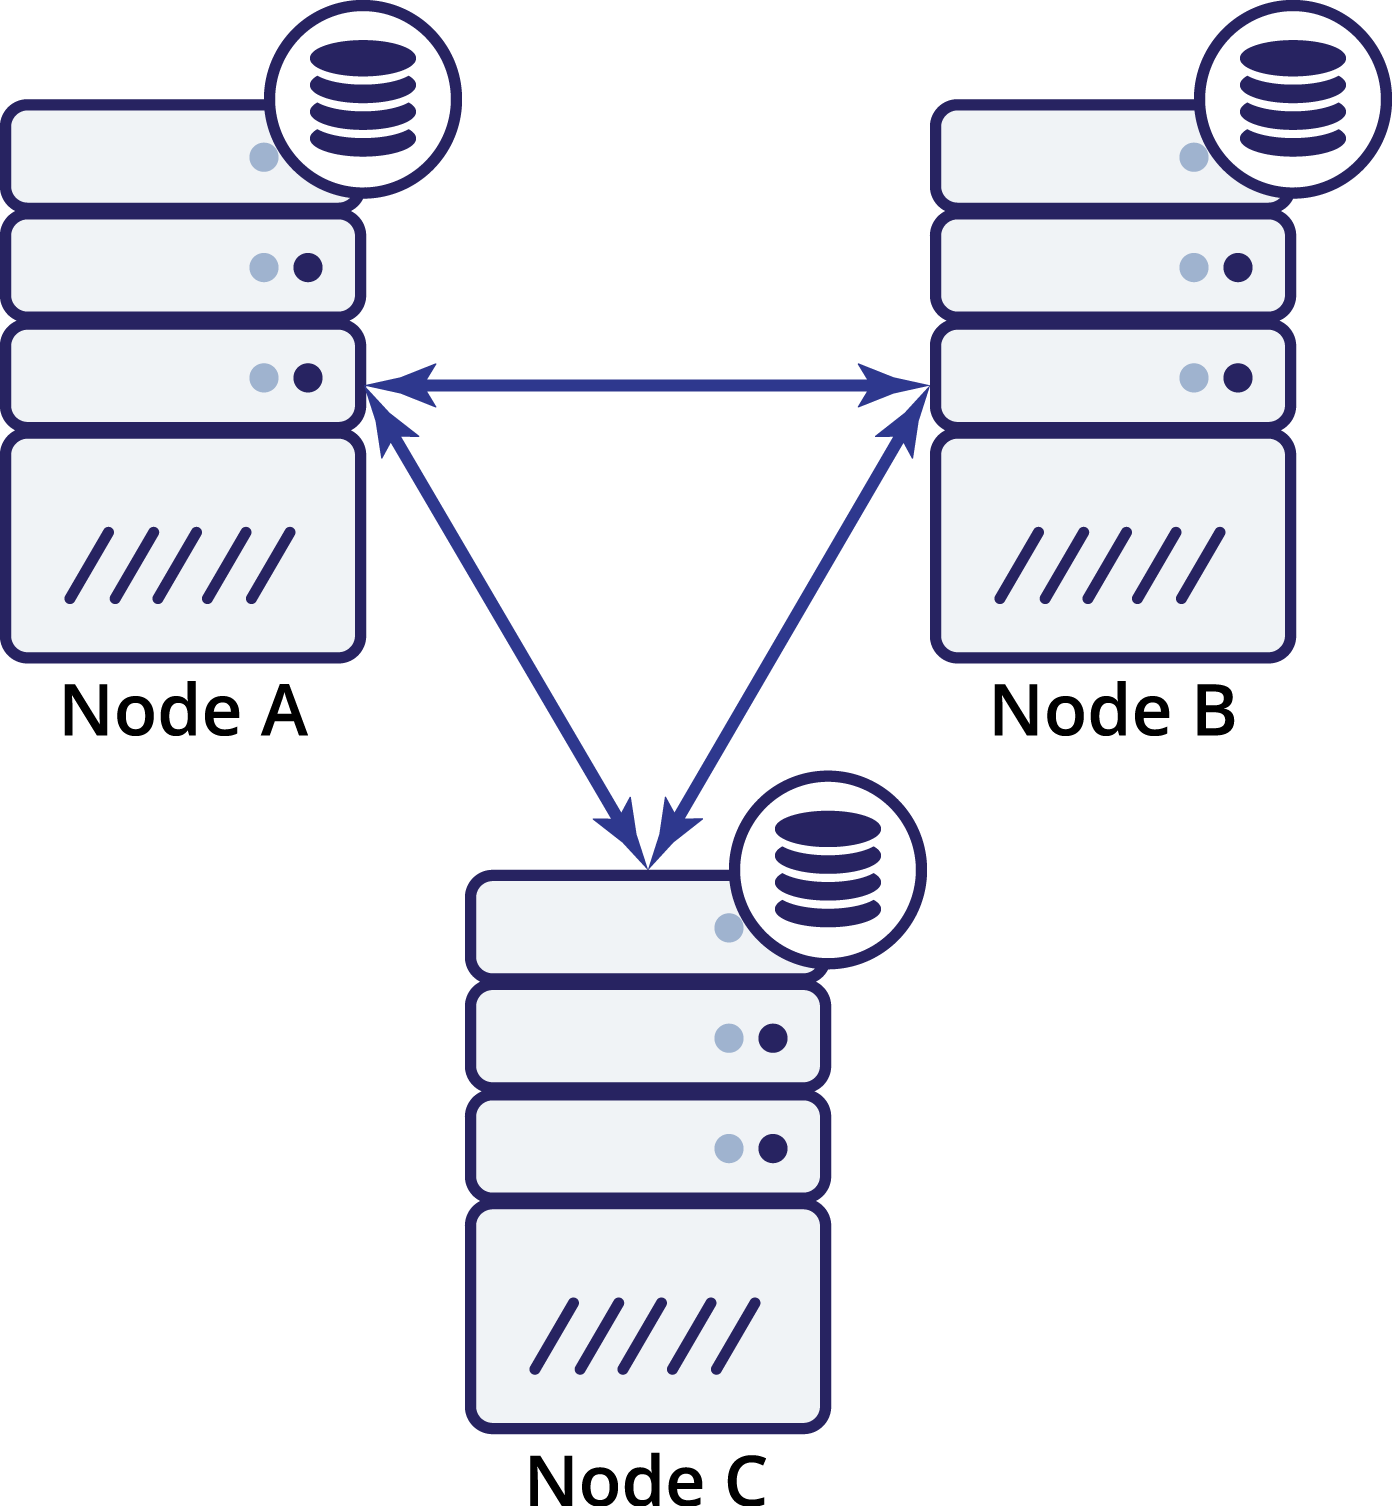
So we now have three nodes: A, B and C. All are interconnected, all are handling reads and writes.
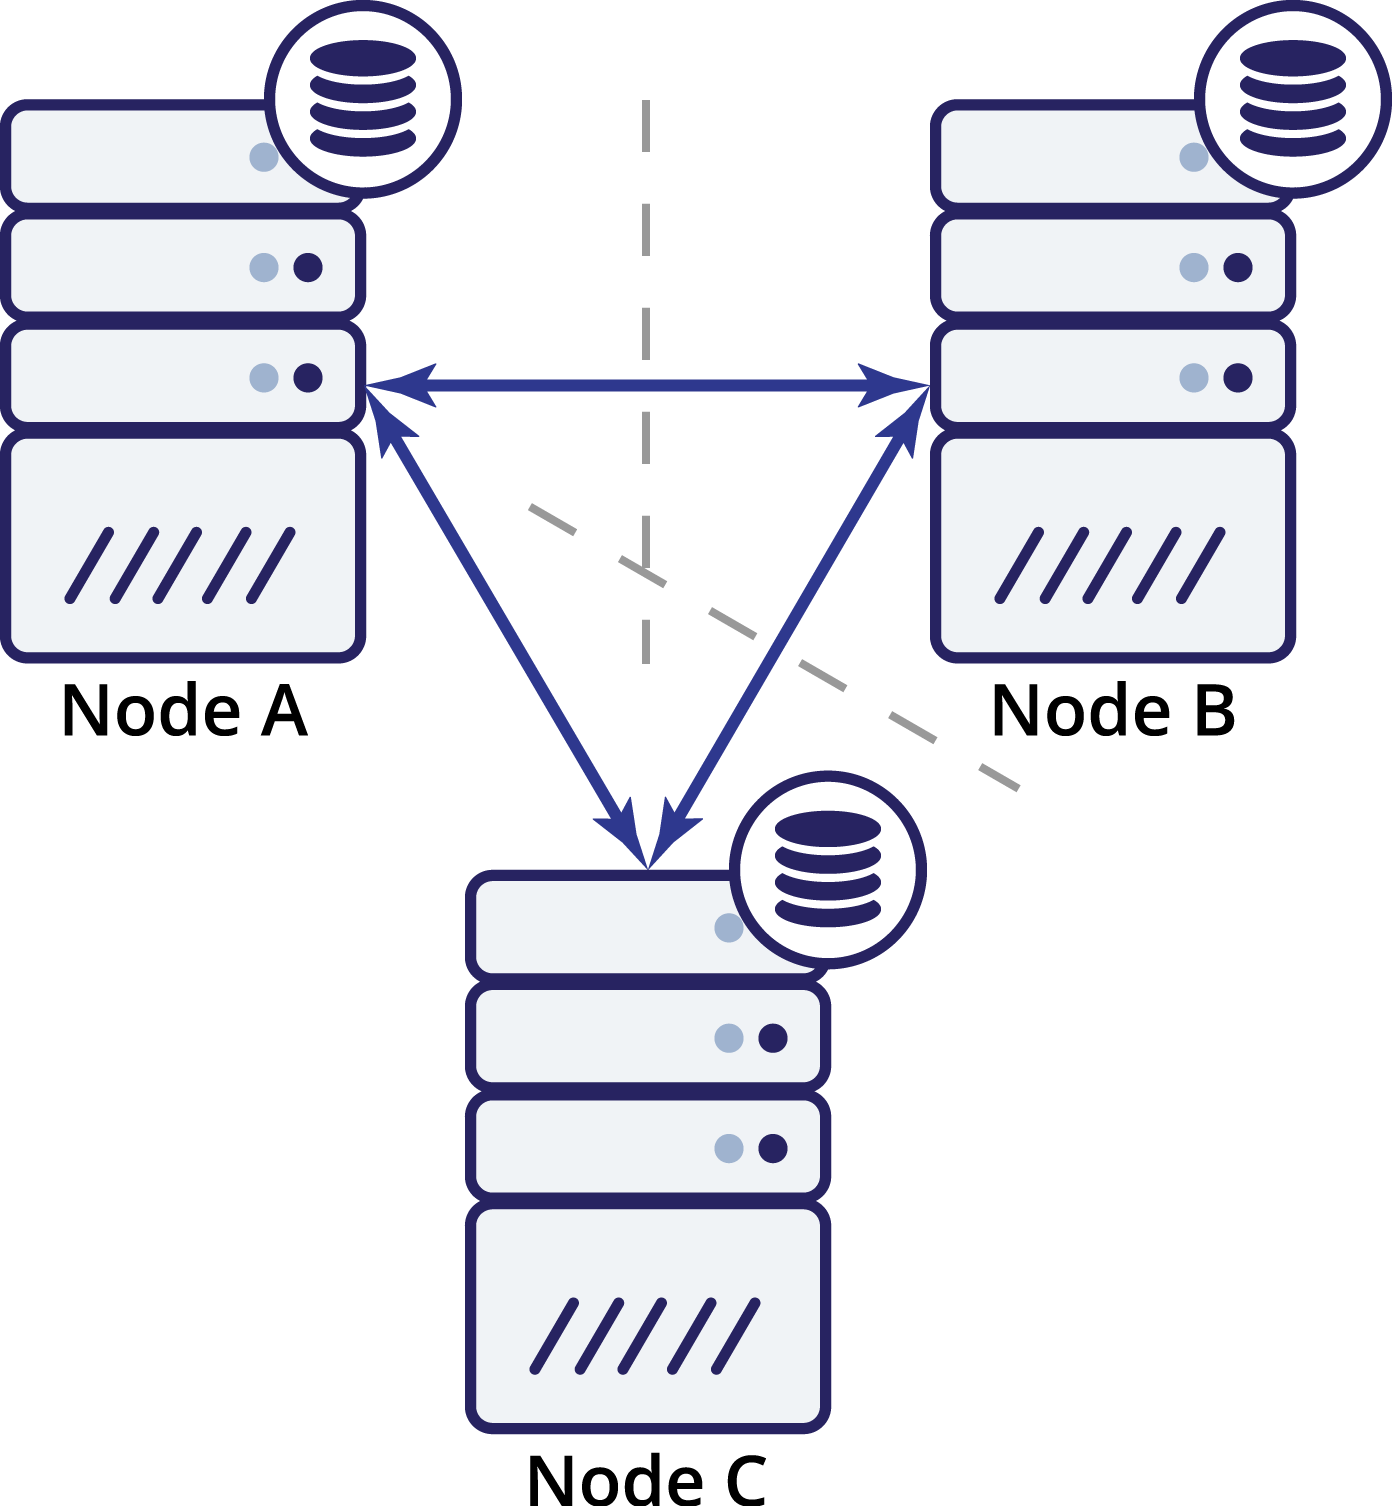
Again, as in the previous example, node B has been cut off from the rest of the cluster due to network issues. What can happen next? Well, the situation is fairly similar to what we discussed earlier. Two options – node B can either be down (and the rest of the cluster should continue) or it can be up, in which case it shouldn’t be allowed to handle any traffic. Can we now tell what’s the state of the cluster? Actually, yes. We can see that nodes A and C can talk to each other and, as a result, they can agree that node B is not available. They won’t be able to tell why it happened, but what they know is that out of three nodes in the cluster two still have connectivity between each other. Given that those two nodes form a majority of the cluster, it makes possible to continue handling traffic. At the same time node B can also deduct that the problem is on its side. It cannot access neither node A nor node C, making node B separated from the rest of the cluster. As it is isolated and is not part of a majority (1 of 3), the only safe action it can take is to stop serving traffic and refuse to accept any queries, ensuring that data drift won’t happen.
Of course, it doesn’t mean you can have only three nodes in the cluster. If you want better failure tolerance, you may want to add more. Keep in mind, though, it should be an odd number if you want to improve high availability. Also, we were talking about “nodes” in the examples above. Please keep in mind that this is also true for datacenters, availability zones etc. If you have two datacenters, each having the same number of nodes (let’s say three nodes each), and you lose connectivity between those two DC’s, same principles apply here – you cannot tell which half of the cluster should start handling traffic. To be able to tell that, you have to have an observer in a third datacenter. It can be yet another set of nodes, or just a single host, with the task
to observe the state of remaining dataceters and take part in making decisions (an example here would be the Galera arbitrator).
Single Points of Failure
High availability is all about removing single points of failure (SPOF) and not introducing new ones in the process. What are the SPOFs? Any part of your infrastructure which, when failed, brings downtime as defined in SLA, is called a SPOF. Infrastructure design requires a holistic approach, the different components cannot be designed independently of each other. Most likely, you are not responsible for the whole design –
database administrators tend to focus on databases and not, for example, the network layer. Still, you have to keep the other parts in mind and work with the teams which are responsible for them, to make sure that not only the part you are responsible for is designed correctly but also that the remaining bits of the infrastructure were designed using the same principles. On top of that, such knowledge of how the whole
infrastructure is designed, helps you to design the database stack too. Knowing what issues may happen helps to build some mechanisms to prevent them from impacting the availability of the database.