blog
How to use the ClusterControl REST API to Automate Your Database Cluster

For ops folks with multiple environments and instances to manage, a fully programmable infrastructure is the basis for automation. ClusterControl exposes all functionality through a REST API. The web UI also interacts with the REST API to retrieve monitoring data (cluster load, alarms, backup status, etc.) or to send management commands (add/remove nodes, run backups, upgrade a cluster, add/remove load balancer, etc.). The API is written in PHP and runs under Apache. The diagram below illustrates the architecture of ClusterControl.
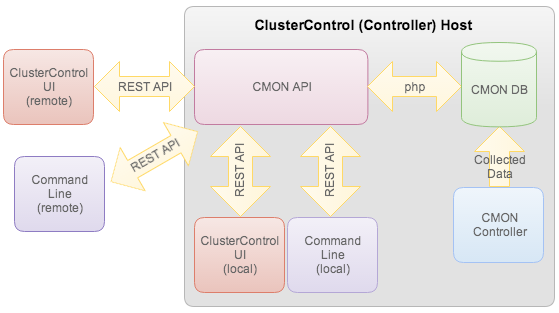
Figure: ClusterControl – Agentless Architecture
In this blog post, we will show you how to interact directly with the ClusterControl API to retrieve monitoring data or to perform management tasks.
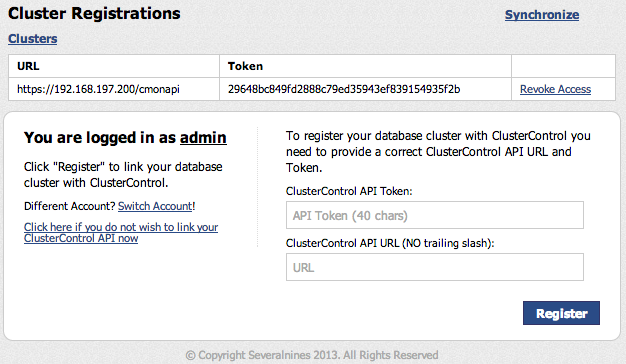
All requests against ClusterControl API URL should include the ClusterControl API Token as HTTP header (CMON_TOKEN) for authentication. The ClusterControl API URL and token can be retrieved from the Cluster Registrations page in the ClusterControl UI.
Retrieving Monitoring Data
The request URI with query strings should be in the following format:
/.json?clusterid=&_dc=&
Which represents the following URL example:
http://192.168.197.200/cmonapi/alarms/all.json?clusterid=1&_dc=1394101811&start=0&limit=2
A simple Curl command as below can be used to retrieve all alarms from ClusterControl:
$ curl -s -g -X GET -H 'CMON_TOKEN: 7c9e53faed237b5c5b010fb31a19f7dade175001' 'http://192.168.197.200/cmonapi/alarms/all.json?clusterid=1&_dc=1394101811&start=0&limit=2'
Where,
| HTTP Method | : GET |
| HTTP Header | : CMON_TOKEN: |
| API URL | : //.json |
| Cluster ID | : 1 |
| Unix Timestamp | : 1394101811 |
| Extra Options | : start from 0, and limit the result to 2 (similar to MySQL LIMIT) |
Following list are some of the notable API groups available in ClusterControl 1.2.5:
- Backup
s
backups/all, backups/glacier_job_status, backups/reports, backups/storage_location - Clusters
clusters/all, clusters/aws_metadata, clusters/dbload, clusters/info, clusters/mongodb_info, clusters/host_dbload, clusters/master, clusters/settings, clusters/dbconnections - Hosts
hosts/hosts_stats, hosts/all_mysql_host, hosts/galera_stat_all, hosts/ram_history, hosts/network_history, hosts/cpu_history, hosts/disk_history, hosts/cpu_info - Alarms
alarms/all, alarms/unread, alarms/check_cmon_db - Counters
counters/all, counters/mongo_all - Nodes
nodes/all, nodes/repl_info, nodes/datanodestats, nodes/clusternodes, nodes/hostnames, nodes/innodb_status - Performance
performance/performance_meta, performance/performance_data, performance/probe_info, performance/probe_graph_data - Queries
queries/all, queries/top, queries/mysql_histogram - Health
health/criticalmodules, health/memoryusage, health/status, health/modules - Jobs
jobs/all, jobs/unread, jobs/message - Processes
processes/all, processes/top, processes/mongo_processes - Email
email/all
Some API groups can be called with extra query strings (alarms/all, jobs/all):
start=, limit=, sort=[{“property”:””,”direction”:””}]
The JSON output will be something like this:
{
    "data": [
        {
            "alarm_count": "9",
            "alarm_id": "1",
            "alarm_name": "Excessive RAM Usage",
            "alarm_sent": "1",
            "alarm_sent_count": "3",
            "alarm_type": "host",
            "cid": "1",
            "component": "RAM",
            "description": "RAM Utilization for 192.168.197.201 is 84 percent",
            "hostid": "2",
            "hostname": "192.168.197.201",
            "recommendation": "Upgrade Node with more RAM",
            "report_ts": "1394434707",
            "severity": "WARNING"
        },
        {
            "alarm_count": "32",
            "alarm_id": "1",
            "alarm_name": "System Time is drifting.",
            "alarm_sent": "1",
            "alarm_sent_count": "0",
            "alarm_type": "simple",
            "cid": "1",
            "component": "ALARM_SOURCE_CLUSTER",
            "description": "System time is drifting between servers and the distance between the highest system time and lowest is 5933 seconds.",
            "hostid": "0",
            "hostname": "",
            "recommendation": "Synchronize the system clock on the servers using e.g NTP or make sure NTP is working. Time drifting may lead to unexpected failures or problems, and makes debugging hard.",
            "report_ts": "1394434710",
            "severity": "WARNING"
        }
    ],
    "success": true,
    "total": 1
}
Sending Management Commands
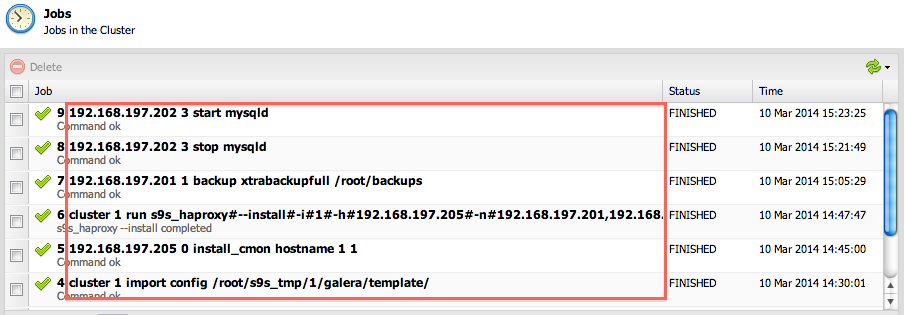
To create a job or task, we can easily do this by sending a POST method with data containing a job command with the respective cluster ID. The job command can be retrieved from the list of Jobs in the Cluster inside ClusterControl UI, as shown in the following screenshot:
The request URI to post a job should be in the following format:
/jobs/job_command
The POST data should contain the cluster ID and job command with or without URL encoded format. A simple Curl command below can be used to post a job to stop MySQL service on node 192.168.197.202 (node ID is 3) under cluster ID 1:
$ curl -s -X POST -H 'CMON_TOKEN: 7c9e53faed237b5c5b010fb31a19f7dade175001' -d "clusterid=1&job_command='192.168.197.202 3 stop mysqld'" 'http://192.168.197.200/cmonapi/jobs/job_command'
Where,
| HTTP Method | : POST |
| HTTP Header | : CMON_TOKEN: |
| API URL | : /jobs/job_command |
| Cluster ID | : 1 |
| Job Command | : ‘192.168.197.202 3 stop mysql’ |
If the job is accepted by ClusterControl, following JSON output should be returned:
{
    "msg": "",
    "success": true
}
Operations Automation
By leveraging the REST API, we can automate a number of things on our cluster – adding a node, creating a full backup, upgrading the cluster to a new version or performing a rolling restart.
We have written some examples in Bash to interact with the ClusterControl API. You can check out the code in the appendix section further down. You can use the client as below:
- To query data from API group:
$ ./cc_api.sh -r backups/reports
- To post a job to the controller:
$ ./cc_api.sh -j '192.168.197.201 1 backup xtrabackupfull /root/backups'
- To query data from API group with extra option:
$ ./cc_api.sh -r alarms/all -o 'start=0&limit=5&sort=[{"property":"alarm_count","direction":"ASC"}]'
We will use the Bash API client (cc_api.sh) to build an auto-scaling feature trigger by a simple application logic (auto_scale.sh). Here is the brief scenario:
We have a two-node Galera cluster with a garbd co-located inside ClusterControl host. If the total queries is higher than 200/s for one minute, then a standby MySQL server (primarily, it is a DNS server) will be automatically started and added to the Galera cluster. Once the QPS is lower than 200/s for more than one minute, this node will be automatically removed from the Galera cluster.
The architecture can be illustrated as in following figure:
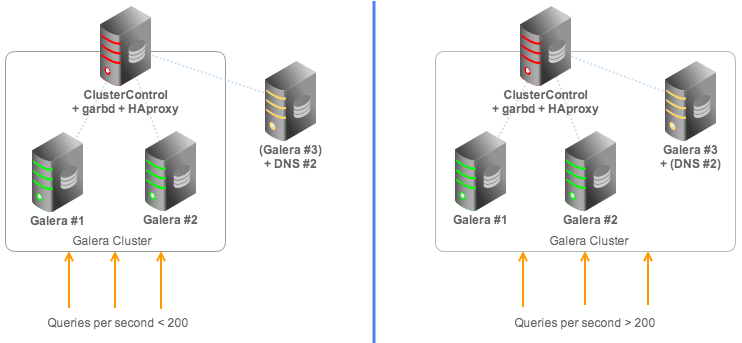
In this test scenario, we have actually added Galera #3 into the HAproxy load balancing set and when it joins into the cluster, it will automatically perform SST/IST and start serving up the cluster once synced.
The auto scale operation is recorded in following Asciinema screencast:
Good luck with automating your database infrastructure!
Appendix
Simple Bash API Client – cc_api.sh
#!/bin/bash
# ClusterControl API Client
# curl, openssl, python2.6+ must be installed
# usage: cc_api.sh [-r|-j] [-o]

## ClusterControl details
ccapi_url='http://192.168.197.200/cmonapi'
ccapi_token='29648bc849fd2888c79ed35943ef839154935f2b'
##

check_binary ()
{
  binaries=$*
  for binary in $binaries
  do
    bin_path=`command -v $binary`
    [ -z "$bin_path" ] && echo "Error: Unable to find binary path for $binary" && exit 1
  done
}

check_var ()
{
  vars=$*
  for var in $vars
  do
    [ -z "$var" ] && echo "Error: $var is empty" && exit 1
  done

}

check_binary curl openssl python
check_var ccapi_url ccapi_token

## calculate token with sha1
cmon_token=`echo -n "$ccapi_token" | openssl dgst -sha1 | awk {'print $2'}`
unix_timestamp=$(date -d "today" "+%s")

usage() {
  echo "-i : cluster ID [default=1]"
  echo "-r : retrieve data in JSON format"
  echo "-j : post job to ClusterControl"
  echo "-o : extra parameters when retrieve data"
}
while getopts ":i:r:j:o:" arg; do
  case "$arg" in
    i) cluster_id="$OPTARG" <span>;;< span="">
    r) retrieve="$OPTARG" <span>;;< span="">
    j) job="$OPTARG" <span>;;< span="">
    o) options="$OPTARG" <span>;;< span="">
    -) break <span>;;< span="">
    ?) usage
    exit 1<span>;;< span="">
  esac
done

[ -z "$cluster_id" ] && cluster_id=1
([ -z "$retrieve" ] && [ -z "$job" ]) && echo "Please specify either -r to retrieve data or -j to post job" && exit 1
([ ! -z "$retrieve" ] && [ ! -z "$job" ]) && echo "Error: -r and -j cannot be used simultaneously" && exit 1
if [ ! -z "$retrieve" ]then
  group="backups/all backups/glacier_job_status backups/schedules backups/reports backups/storage_location
  clusters/all clusters/aws_metadata clusters/dbload clusters/info clusters/mongodb_info clusters/host_dbload clusters/master clusters/settings clusters/dbconnections
  hosts/hosts_stats hosts/all_mysql_host hosts/galera_stat_all hosts/ram_history hosts/network_history hosts/cpu_history hosts/disk_history hosts/cpu_info
  alarms/all alarms/unread alarms/check_cmon_db
  counters/all counters/mongo_all
  nodes/all nodes/repl_info nodes/datanodestats nodes/clusternodes nodes/hostnames nodes/innodb_status
  performance/performance_meta performance/performance_data performance/probe_info performance/probe_graph_data
  queries/all queries/top queries/mysql_histogram
  health/criticalmodules health/memoryusage health/status health/modules
  jobs/all jobs/unread jobs/message
  processes/all processes/top processes/mongo_processes
  email/all
  "
  i=0
  for f in $group
  do
    [ "$f" == "$retrieve" ] && i=0 && break
    ((i++))
  done
  [ $i -ne 0 ] && echo "Error: Unknown options "$retrieve"" && exit 1
  url="$ccapi_url/$retrieve.json?clusterid=$cluster_id&_dc=$unix_timestamp&$options"
fi

post_data=
if [ ! -z "${job}" ]then
  post_data="-d clusterid=$cluster_id&jobcommand=${job}"
  url="$ccapi_url/jobs/job_command"
fi

result=`curl -g -s -H "CMON_TOKEN: $cmon_token" "$post_data" "$url"`
echo $result | python -mjson.tool</span>;;<></span>;;<></span>;;<></span>;;<></span>;;<></span>;;<>
Automatic Scaling – auto_scale.sh
#!/bin/bash
# Perform auto scale if Queries Per Second (QPS) is more than 200 for 1 minute (5 sec interval)

[ -z "$1" ] && echo "Error: Please specify a target host" && exit 1
ip=$1

threshold=200 # QPS threshold
interval=5    # check interval in seconds
duration=60   # duration in seconds

# cc_api.sh location
cc_api=/vagrant/cc_api.sh
# get nodeid
nodeid=$($cc_api -r hosts/all_mysql_host | grep -A10 $ip | grep nodeid | awk {'print $2'} | sed 's|"||g' | sed 's|,||g')

i=0j=0
check=$(( $duration/$interval ))

while truedo
  for n in { 1 .. $check }
  do
    date=$(date +"%T")
    result=$($cc_api -r clusters/info | grep qps | awk {'print $2'} | sed 's|"||g' | sed 's|,||g')
    # convert to int
    qps=${result/.*}
    if [ $qps -gt $threshold ]then
      # count +1 if over threshold
      ((i++))
      echo "Counter: $i - $qps/$threshold - $date"
    else
      [ $i -ne 0 ] && ((i--)) || ((j++))
      echo "Counter: $i - $qps/$threshold - $date"
    fi
    sleep $interval
  done

  date=$(date +"%T")

  if [ $i -ge $check ]then
    # check node status
    node_status=$($cc_api -r hosts/all_mysql_host | grep -A10 $ip | grep status | awk {'print $2'} | sed 's|"||g' | sed 's|,||g')
    if [ "$node_status" != 0 ]then
      # start up
      echo "!!! Firing up $ip - $date !!!"
      $cc_api -j "$ip $nodeid start mysqld"
      i=0
    else
      echo "Host is already up"
    fi
  fi

  if [ $j -ge $check ]then
    # check node status
    node_status=$($cc_api -r hosts/all_mysql_host | grep -A10 $ip | grep status | awk {'print $2'} | sed 's|"||g' | sed 's|,||g')
    if [ "$node_status" == 0 ]then
      # bring down
      echo "!!! Bringing down $ip - $date !!!"
      $cc_api -j "$ip $nodeid stop mysqld"
    else
      echo "Host is already down"
    fi
    j=0
  fi
done