blog
Enabling enterprise logging with Elasticsearch, Kibana, and ClusterControl

Today’s typical enterprise database deployment footprint consists of different types of databases, each suited to the applications serving specific business needs. This may include SQL (MySQL/MariaDB, PostgreSQL, Redis, SQL Server, etc) and NoSQL (MongoDB, Redis, etc).
Having tens if not hundreds or even thousands of database instances running in an enterprise, depending on the size of the enterprise, makes it a nightmare to centralize database logs which would subsequently make it convenient to analyze the logs for multiple purposes, including but not limited to, root cause analysis of performance problems, and threat analysis and detection.
In this post, we will show how one can accomplish this by combining ClusterControl with Elasticsearch to, A) centralize logs from database instances, and B) analyze those logs. Let’s start with covering why enterprises often opt for Elasticsearch to handle logging duties.
Why Elasticsearch for enterprise logging?
Elasticsearch is a scalable document store that is capable of storing unstructured documents and performing searches over those documents in a highly efficient and performant manner. This makes it a suitable candidate for storing database logs and subsequently searching those logs.
Enterprises typically store database logs from all the databases of their enterprise-wide fleet in a single centralized Elasticsearch store and allow analysts to explore and search for useful information (e.g. detect potential unauthorized access or other related cyber threats and root-cause potential performance problems with the database) in those logs.
Why ClusterControl for Elasticsearch ops?
ClusterControl is a database orchestration platform to manage and monitor database operations on-premises and public, private, or hybrid cloud environments. It covers the full-ops milieu, such as database provisioning, performance monitoring, fault detection, disaster recovery, and much more.
For a full list of capabilities, please refer to the pricing page.
Now that you know what ClusterControl is and how it’ll actually mediate Elasticsearch operations, and why you want to use Elasticsearch for log aggregation, let’s look at the process for deploying and configuring Elasticsearch for log aggregation, Kibana for visualization, and of course Filebeat for transferring those logs.
Setting up Elasticsearch for log aggregation
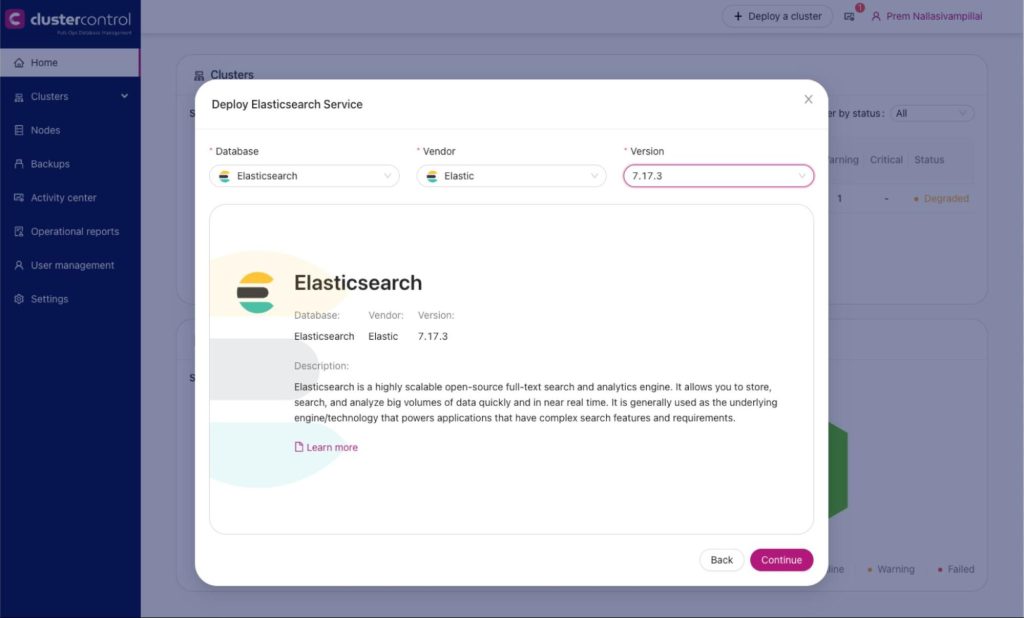
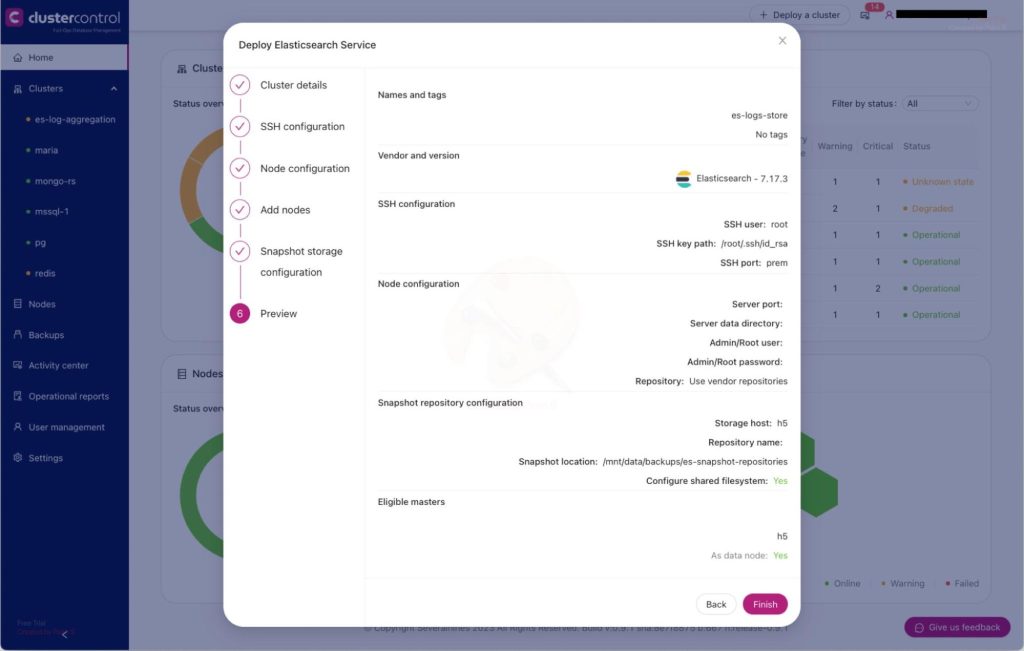
We will use ClusterControl to deploy an Elasticsearch (version 7.x) cluster which will be used to store the logs from multiple database instances in an enterprise. The following screencap shows how to deploy an Elasticsearch cluster.
We need to take note of some details in order to be able to access the Elasticsearch instance:
- Coordinates of the endpoint: http://<host>:<port> (e.g. http://h5:9200)
- Login credentials (username and password). E.g. “esadmin” and “es7Admin”
Setting up Kibana for log visualization
We will also set up Kibana, on the same host as the Elasticsearch host, in order to be able to search and explore logs stored in our Elasticsearch. Here are instructions to install and configure Kibana. (NOTE: instructions are for Ubuntu/Debian. Please perform equivalent for RHEL and equivalent distributions).
$ wget -qO - https://artifacts.elastic.co/GPG-KEY-elasticsearch | sudo gpg --dearmor -o /usr/share/keyrings/elasticsearch-keyring.gpg
$ sudo apt-get install apt-transport-https
$ echo "deb [signed-by=/usr/share/keyrings/elasticsearch-keyring.gpg] https://artifacts.elastic.co/packages/7.x/apt stable main" | sudo tee /etc/apt/sources.list.d/elastic-7.x.list
$ sudo apt-get update && sudo apt-get install kibana
$ sudo update-rc.d kibana defaults 95 10
$ sudo /bin/systemctl daemon-reload
$ sudo /bin/systemctl enable kibana.service


$ sudo cp /etc/kibana/kibana.yml /etc/kibana/kibana.yml.orig


$ sudo vi /etc/kibana/kibana.yml
# search the following arguments and set the corresponding values as shown below
server.port: 5601
server.host: "0.0.0.0"
elasticsearch.hosts: ["http://h5:9200"]
kibana.index: ".kibana"
kibana.defaultAppId: "home"
elasticsearch.username: "esadmin"
elasticsearch.password: "es7Admin"


$ sudo systemctl start kibana
Setting up Filebeat for database logs
Filebeat will be used to push logs from the database nodes/hosts to the Elasticsearch. Filebeat should be installed on each of the database nodes.
General filebeat installation irrespective of the database type is as follows. We will install the OSS edition of filebeat. You have the option to install the enterprise version as well (see commented line below).
NB: instructions are for Ubuntu/Debian. Please perform equivalent for RHEL and equivalent distributions.
$ wget -qO - https://artifacts.elastic.co/GPG-KEY-elasticsearch | sudo apt-key add -
$ sudo apt-get install apt-transport-https
# echo "deb https://artifacts.elastic.co/packages/7.x/apt stable main" | sudo tee -a /etc/apt/sources.list.d/elastic-7.x.list
$ echo "deb https://artifacts.elastic.co/packages/oss-7.x/apt stable main" | sudo tee -a /etc/apt/sources.list.d/elastic-7.x.list
$ sudo apt-get update && sudo apt-get install filebeat
$ sudo update-rc.d filebeat defaults 95 10
$ sudo systemctl daemon-reload
$ sudo systemctl enable filebeat


$ sudo vi /etc/filebeat/filebeat.yml
setup.kibana:
  # Kibana Host
  # Scheme and port can be left out and will be set to the default (http and 5601)
  # In case you specify and additional path, the scheme is required: http://localhost:5601/path
  # IPv6 addresses should always be defined as: https://[2001:db8::1]:5601
  host: "h5:5601"


output.elasticsearch:
  # Array of hosts to connect to.
  hosts: ["h5:9200"]
  # Protocol - either `http` (default) or `https`.
  #protocol: "https"
  # Authentication credentials - either API key or username/password.
  #api_key: "id:api_key"
  username: "esadmin"
  password: "abc123"


$ filebeat test output
$ filebeat modules list


# Note: enable the appropriate module for the database type on the host. The enterprise version of filebeat
# has support for Oracle, MSSQL, etc
$ filebeat modules enable redis | mysql | postgresql | mongodb
$ filebeat setup -e
$ filebeat setup --dashboards


$ sudo systemctl start filebeat
Once installed on a database node, filebeat should start pushing database logs from the database host to Elasticsearch. This would allow us to explore and analyze those logs using the Kibana.
PostgreSQL log path modification
Modify filebeat manifest for Postgres to include the highlighted line below. Substitute the appropriate Postgres version for “<version>”. Then restart filebeat. (e.g. “systemctl restart filebeat”)
root@h7:/var/log# vi /usr/share/filebeat/module/postgresql/log/manifest.yml
module_version: "1.0"
var:
  - name: paths
    default:
      - /var/log/postgresql/postgresql-*-*.log*
      - /var/log/postgresql/postgresql-*-*.csv*
      - /var/lib/postgresql/<version>/main/log/postgresql-*.log*
    os.darwin:
      - /usr/local/var/postgres/*.log*
      - /usr/local/var/postgres/*.csv
    os.windows:
      - "c:/Program Files/PostgreSQL/*/logs/*.log*"
      - "c:/Program Files/PostgreSQL/*/logs/*.csv"
ingest_pipeline:
  - ingest/pipeline.yml
  - ingest/pipeline-log.yml
  - ingest/pipeline-csv.yml
input: config/log.yml
MongoDB modification
Modify filebeat manifest for MongoDB to include the highlighted line below. Then restart filebeat. (e.g. “systemctl restart filebeat”)
# For MongoDB
vi /usr/share/filebeat/module/mongodb/log/manifest.yml
module_version: 1.0


var:
  - name: paths
    default:
      #- /var/log/mongodb/mongodb.log
      - /var/log/mongodb/mongod.log
    os.windows:
      - c:\data\log\mongod.log


ingest_pipeline:
  - ingest/pipeline.yml
  - ingest/pipeline-plaintext.yml
  - ingest/pipeline-json.yml
input: config/log.yml
Logging into Kibana to visualize logs
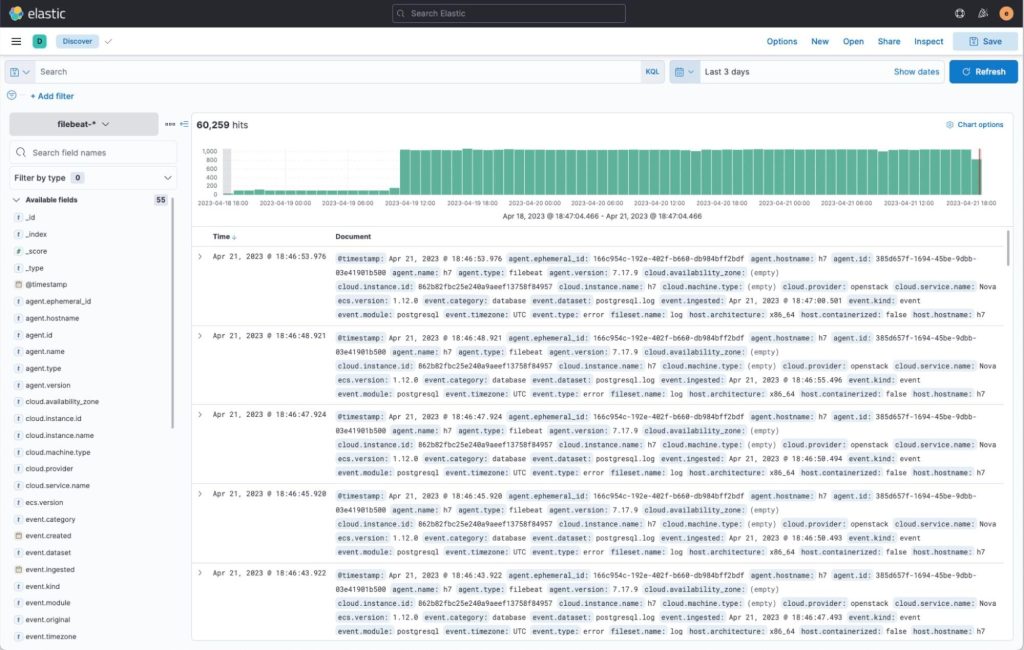
Point your browser to the kibana host port 5601 and log into kibana using the credentials used during installation and setup. (e.g. http://<kibana-host>:5601). Once successfully logged in to Kibana, navigate to “Analytics => Discover”. There should be an index that has already been created in Elasticsearch called “filebeat-*” and you should be able to view logs that are coming through from the databases as shown below.
There are also custom dashboards for visualizing logs for specific database types. These dashboards are available under “Dashboards”. I’ve prepared some predefined logs visualization dashboards for MySQL/MariaDB, PostgreSQL, MongoDB and Redis and pointed out some of their specific log types below.
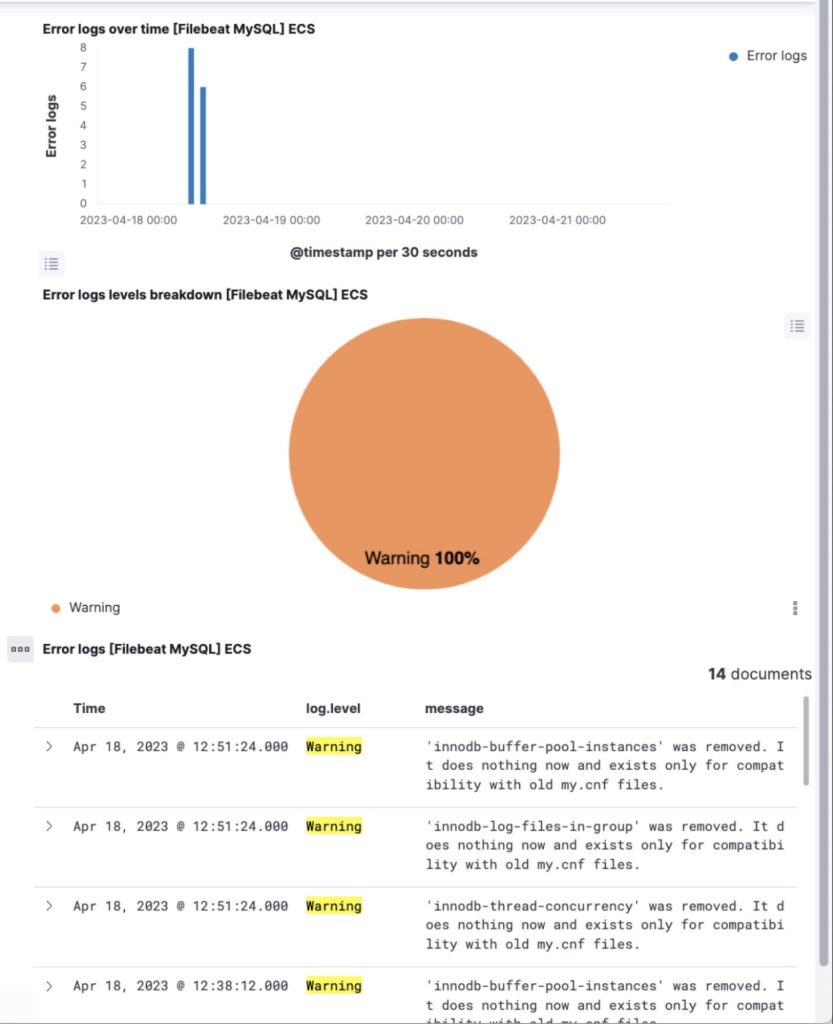
MySQL/MariaDB
The built-in dashboard for MySQL (and/or MariaDB) allows visualization and exploration of logs specific to MySQL and MariaDB. These include slow queries from the slow-query log, mysql error log, and regular mysql daemon log. You can explore these logs to root-cause potential problems and gather information on database access patterns.
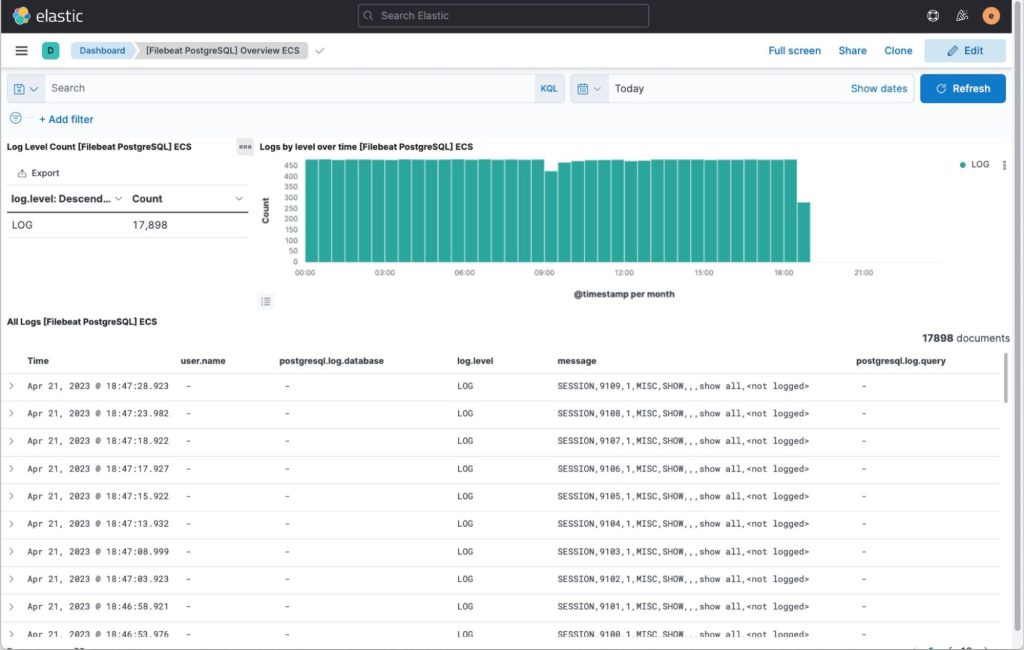
PostgreSQL
The built-in dashboard for PostgreSQL allows you to explore access logs resulting from the pgaudit plugin and general postgresql daemon log.
Here’s a link to enabling slow queries in Postgres.
Visualize Postgres logs, including that of slow queries and audit as shown below.
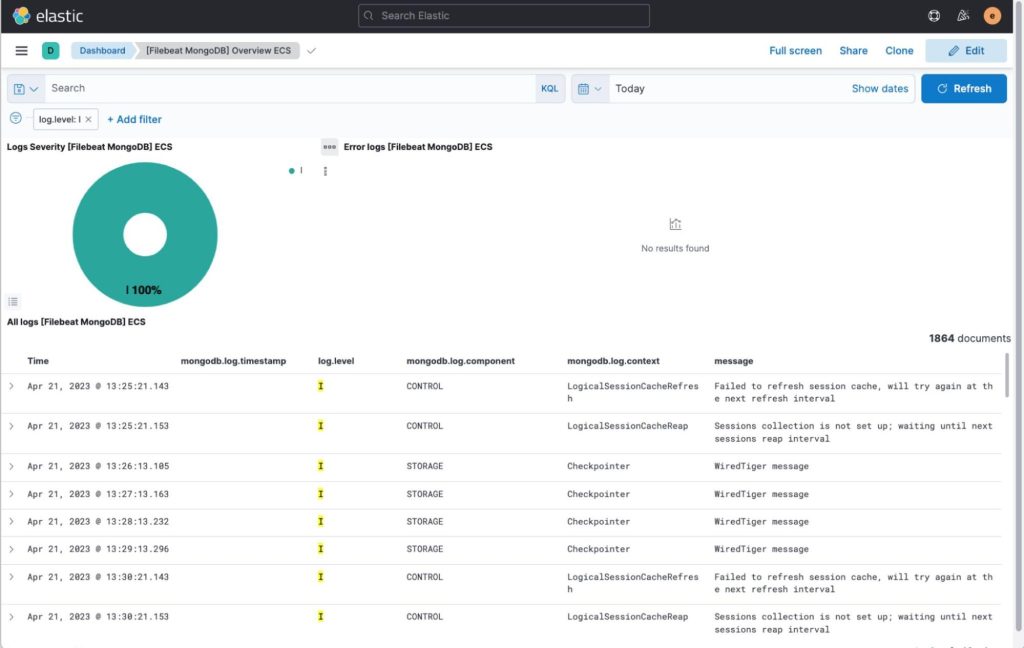
MongoDB
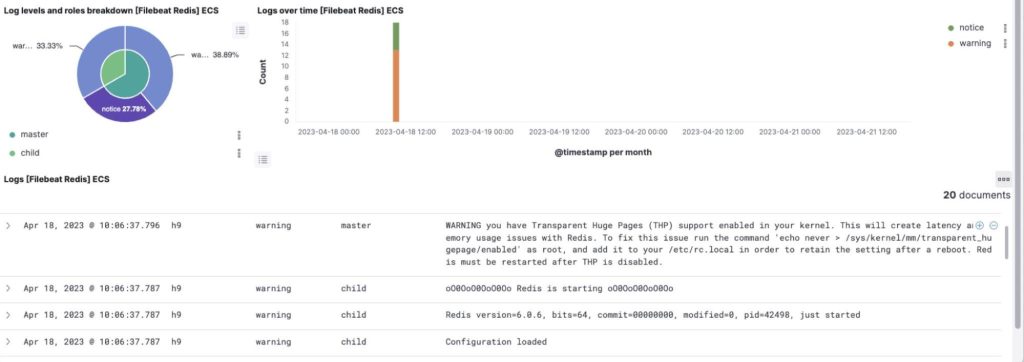
Redis
Wrapping up
We have shown how one can deploy an Elasticsearch cluster using Severalnines ClusterControl and subsequently push database logs to that Elasticsearch cluster using Filebeat and analyze the logs using Kibana.
Using a tool like ClusterControl to orchestrate the operations of your Elasticsearch and the rest of your polyglot, open-source database footprint environment gives you a true single pane of glass over your entire footprint, regardless of environment. Try it out commitment-free for 30 days.
Not looking for a solution at the moment? In the meantime, follow us on LinkedIn & Twitter and subscribe to our newsletter to get more content on open-source database operations best practices and the latest Severalnines updates.