blog
ClusterControl Developer Studio: Creating Advisors Using the MySQL Performance Schema

In the previous blog post, we gave a brief introduction to ClusterControl Developer Studio and the ClusterControl Domain Specific Language that you can use to write your own scripts, advisors and alerts. We also showed how, with just 12 lines of code, you can create an advisor by using one of the ready made templates combined with existing database metrics collected by ClusterControl.
Today we are going one step further: we are going to retrieve data from the MySQL Performance Schema and use this in our advisor.
MySQL Performance Schema
The performance schema is basically a schema that exists in your MySQL instance. It is a special type of schema as it uses the so called PERFORMANCE_SCHEMA storage engine that interfaces with the performance data of your MySQL instance. This allows you to query for specific performance metrics and/or events that happen inside MySQL without locking up your database (e.g. SHOW ENGINE INNODB STATUS locks for a fraction of a second). The performance schema does have a drawback: it is at the cost of performance of your database and has an average of 5% to 10% performance penalty. Given the extra insights you will get from the database engine, and no longer need to lock the InnoDB engine every few seconds, this should actually pay off in the long run.
One of the prerequisites for our advisor is that we need to have the MySQL performance schema enabled, otherwise our queries will return empty results as the schema is empty. You can check if the performance schema is enabled on your host by executing the following command:
SHOW VARIABLES LIKE 'performance_schema';If your host did not have the performance schema enabled you can do this by adding or modifying the following line in the [mysqld] section of your MySQL configuration:
performance_schema = 1This obviously requires a restart of MySQL to become effective.
Available Performance Schema advisors in ClusterControl
ClusterControl ships, by default, a couple of advisors using the Performance Schema:
- Processlist
- Top accessed DB files
- Top queries
- Top tables by IOWait
- Top tables by Lockwait
You can run and schedule these advisors if you have the Performance Schema enabled and they will give you great insight in what is happening inside your cluster. The source code can be found on our github page.
Adding custom advisors
Once the performance schema has been enabled, you should see data inside the performance_schema starting to accumulate. One of the tables we are interested in for this article is the one that keeps information about the indexes per table, per schema: table_io_waits_summary_by_index_usage
The information in this table is pretty interesting if you can keep track of the previous state, take the delta between the two and see the increase/decrease in efficiency. Most interesting metrics in this table are:
- COUNT_STAR: total number of all IO operations (read + write)
- COUNT_READ: total number of all read IO operations
- COUNT_WRITE: total number of all write IO operations
- AVG_TIMER_*: average time taken
However as the advisors only run infrequently and do not keep previous state, this would not be possible at the moment of writing. Therefore we will cover two advisors: unused indexes and queries that are not using indexes.
Unused indexes
We can extract different information from this table than just timers: we can find indexes that have not been touched as they did not receive any read, write or delete operations at all. The query to extract this information would be:
SELECT object_schema AS schema, object_name AS table, index_name AS index FROM performance_schema.table_io_waits_summary_by_index_usage WHERE index_name IS NOT NULL AND count_star = 0 AND object_schema != 'mysql' AND index_name != 'PRIMARY'With this information we can run a daily advisor that extracts this information and advises you to look at this index and drop it if necessary. So in principle we simply have to loop over all hosts in the cluster and run this query.
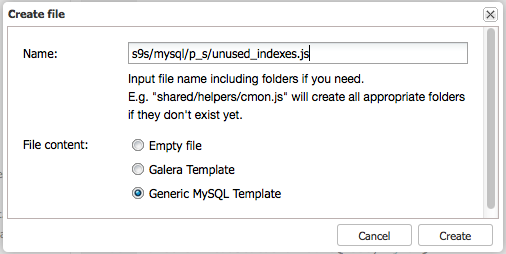
Our new advisor will be based on the Generic MySQL template. So if you create the advisor please select the following:
Querying
At the top of our new advisor, we simply define our query since we don’t need any host specific information:
var query="SELECT `object_schema` AS `schema`, `object_name` AS `table`, `index_name` AS `index`"
"FROM `performance_schema`.`table_io_waits_summary_by_index_usage` "
"WHERE `index_name` IS NOT NULL "
"AND `count_star` = 0 "
"AND `object_schema` != 'mysql' "
"AND `index_name` != 'PRIMARY'";
Now inside the host loop we first have to check if the Performance Schema is enabled, otherwise the query will fail and the advisor will output an error:
if (!readVariable(host, "performance_schema").toBoolean())
{
   print(host, ": performance_schema is not enabled.");
   continue;
}
Also inside the host loop, we run our query on each host:
result = getValueMap(host, query);The function getValueMap is a predefined function in the mysql_helper.js that is included by default if you create a new MySQL or Galera advisor. This function will accept host and query as parameters and returns a map (array) per row with its columns. So, for example, if we wish to print the second column of the first row, we should do the following:
print(result[0][1]);The getValueMap function returns false if there are no rows found, so we have to cover the case of all indexes being used.
if (result == false)
{
  msg = concatenate(msg, "No unused indexes found on this host.");
  advice.setJustification(ADVICE_OK);
  advice.setSeverity(Ok);
}
The message in the msg variable will be printed later as we may have to include additional information. As the message will be used in the advisors page, we have included HTML formatting here. We also have to set the right severity and justification per host whether there is an unused index present.
for (i=0; i
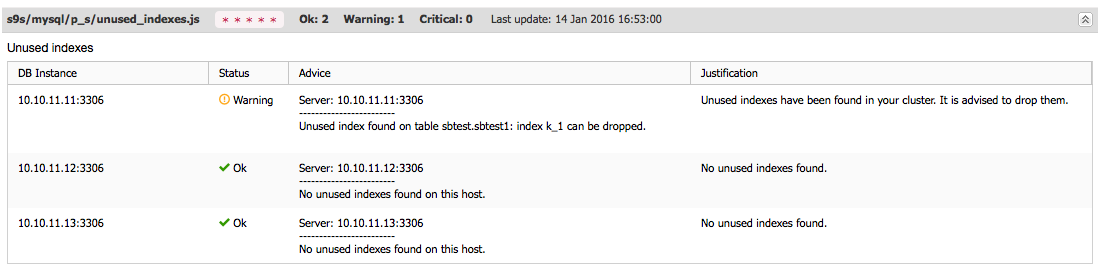
In the case of an unused index, it will output a message like this:
Unused index found on table sbtest.sbtest1: index k_1 can be dropped.
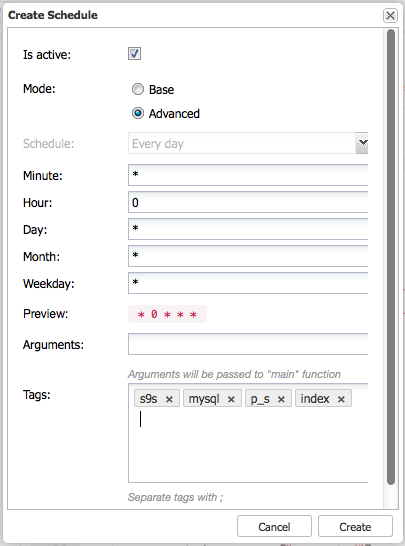
Scheduling
Now if we would schedule once per day, this advisor will run once a day and become available in the advisor page:
And after it has run successfully, we can see that it does work as expected:
Unused indexes - The complete advisor script
#include "common/mysql_helper.js"

/**
 * Checks the index usage and warns if there are unused indexes present
 *
 */
var TITLE="Unused indexes";
var ADVICE_WARNING="Unused indexes have been found in your cluster. It is advised to drop them.";
var ADVICE_OK="No unused indexes found.";

var query="SELECT `object_schema` AS `schema`, `object_name` AS `table`, `index_name` AS `index`"
"FROM `performance_schema`.`table_io_waits_summary_by_index_usage` "
"WHERE `index_name` IS NOT NULL "
"AND `count_star` = 0 "
"AND `object_schema` != 'mysql' "
"AND `index_name` != 'PRIMARY'";

function main()
{
    var hosts     = cluster::mySqlNodes();
    var advisorMap = {};

    for (idx = 0; idx < hosts.size(); ++idx)
    {
        host        = hosts[idx];
        map         = host.toMap();
        connected     = map["connected"];
        var advice = new CmonAdvice();

        if(!connected)
            continue;
        if (!readVariable(host, "performance_schema").toBoolean())
        {
            print(host, ": performance_schema is not enabled.");
            continue;
        }
        result = getValueMap(host, query);
        msg = concatenate("Server: ", host, "
Tables with no indexes used
Just like extracting the unused indexes from the Performance Schema, we can also find which tables have been accessed without using indexes.
SELECT `object_schema`, `object_name`, `count_star`, `count_read`, `count_write`, `count_delete` FROM performance_schema.table_io_waits_summary_by_index_usage WHERE index_name IS NULL AND count_star > 0 AND object_schema != 'mysql'With this, we can run a daily advisor that extracts this information and advises you to look at the tables that have been queried without using an index. There could be various reasons why an index has not been used, for instance because the update query uses columns that have not been covered by any index.
Our new advisor will be based on the Generic MySQL template, but you could as well copy the previous advisor and adapt it.
Querying
At the top of our new advisor, we define again our query since we don’t need any host specific information:
var query = "SELECT `object_schema`, `object_name`, `count_star`, `count_read`, `count_write`, `count_delete` FROM performance_schema.table_io_waits_summary_by_index_usage WHERE index_name IS NULL AND count_star > 0 AND object_schema != 'mysql'";The code for this advisor will be almost entirely similar to the unused indexes example as we will yet again loop over all hosts in the cluster and check on the indexes. The major difference is the way we interpret and show the data:
for (i=0; i
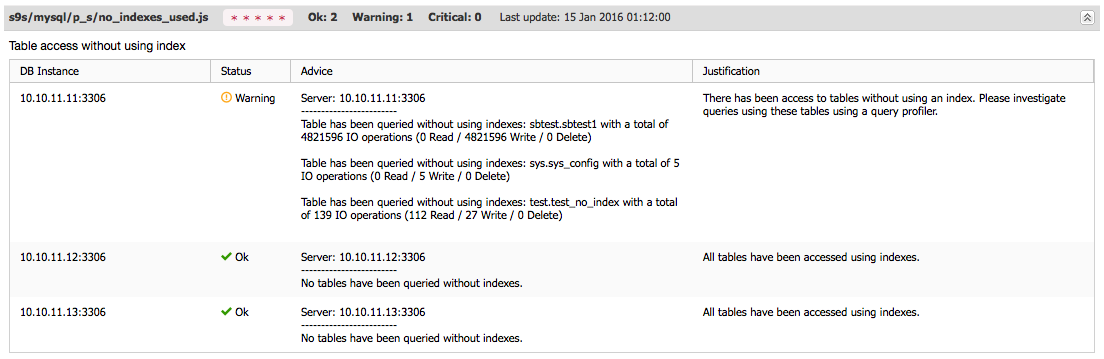
Keep in mind that the information created by this query does not tell us what the exact cause is, it is just an indicator that there is an inefficient table that has X amount of iops specified by read, write and delete operations. Further investigation is necessary.
Scheduling
Similarly as the Unused Indexes advisor, we would schedule this advisor once a day and make it available inside the advisor page:
And after it has ran successfully, we can see that it does work as expected:
Complete advisor script - Tables with no indexes used
#include "common/mysql_helper.js"

/**
 * Checks the index usage and warns if there are unused indexes present
 *
 */
var TITLE="Table access without using index";
var ADVICE_WARNING="There has been access to tables without using an index. Please investigate queries using these tables using a query profiler.";
var ADVICE_OK="All tables have been accessed using indexes.";

var query = "SELECT `object_schema`, `object_name`, `count_star`, `count_read`, "
"`count_write`, `count_delete` "
"FROM performance_schema.table_io_waits_summary_by_index_usage "
"WHERE index_name IS NULL "
"AND count_star > 0 "
"AND object_schema != 'mysql'";

function main()
{
    var hosts     = cluster::mySqlNodes();
    var advisorMap = {};

    for (idx = 0; idx < hosts.size(); ++idx)
    {
        host        = hosts[idx];
        map         = host.toMap();
        connected     = map["connected"];
        var advice = new CmonAdvice();

        if(!connected)
            continue;
        if (!readVariable(host, "performance_schema").toBoolean())
        {
            print(host, ": performance_schema is not enabled.");
            continue;
        }
        result = getValueMap(host, query);
        msg = concatenate("Server: ", host, "
Advisor Repository
All our advisors are freely available through the Advisor Github repository and the two custom advisors are also made available through the repository. We encourage you to share the advisors you have written yourself as they may benefit other ClusterControl users as well.
If you have a Github account you can share back by forking our repository, check in your changes and create a pull request for us. If you don’t have a Github account, you can paste a link to your advisor in the comments section of this blog or email it to us.


