blog
Integrating ClusterControl Alarms with Splunk

Splunk is a popular log management tool for our syslog facility. In this blog, we will show you how to integrate ClusterControl alarms with Splunk.
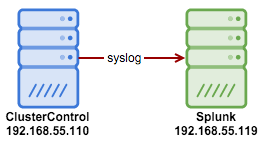
We are going to forward the alarm event through the ClusterControl syslog plugin, where the rsyslog client will forward it over to Splunk via UDP port 514. We will then create an alert in Splunk based on the specific search term.
**For the purpose of this blog post, we are using UDP as the transport protocol. Note that UDP is a connectionless, unreliable protocol that does not guarantee message delivery. If a message gets lost, neither the log device nor the collector is going to know or care. You can use TCP as alternative.
Here is our simple architecture:
On the ClusterControl node, install rsyslog (if not installed) so we can forward the syslog to Splunk.
-
Install rsyslog on ClusterControl node:
$ yum install rsyslog # RHEL/CentOS $ apt-get install rsyslog # Debian/Ubuntu -
Then append the following line into /etc/rsyslog.conf under “catch-all” log files section (line 94):
*.* @192.168.55.119:514 -
Restart syslog to load the new configuration:
$ systemctl restart syslog -
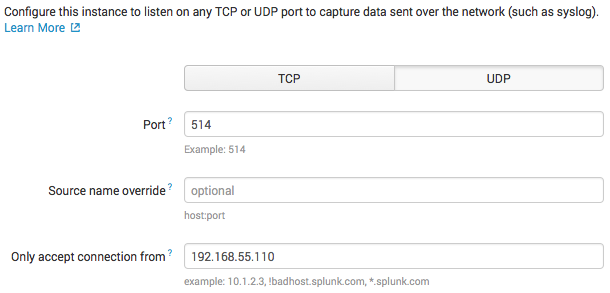
Configure Splunk to listen to incoming syslog on UDP port 514. Go to Splunk > Settings > Data inputs > UDP > New and specify as per below:
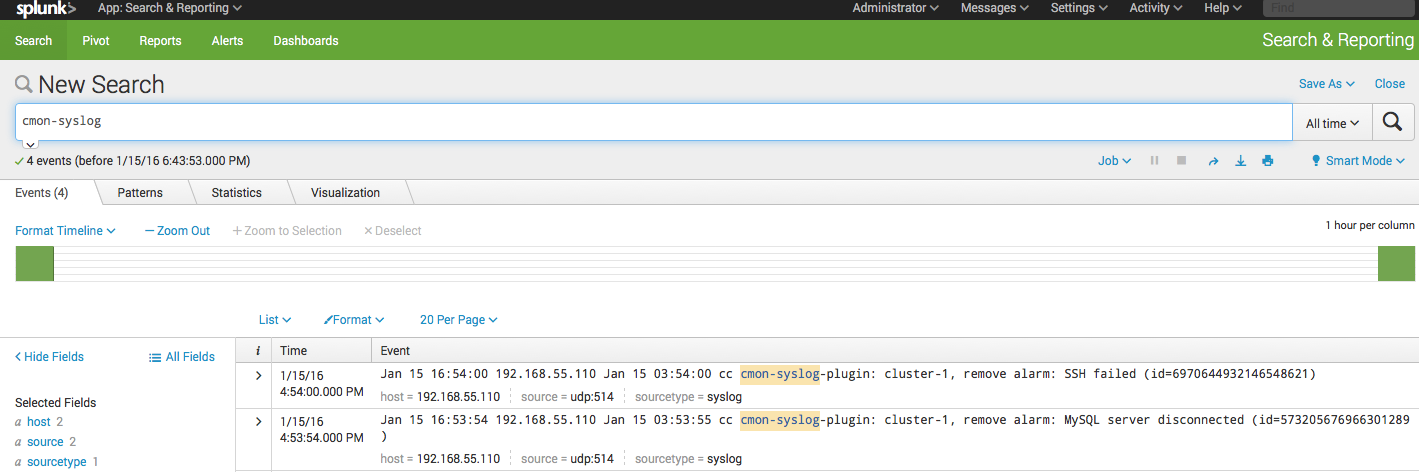
Click ‘Next’. In the ‘Input Settings’, choose syslog as the ‘Source type’ and leave everything default. Then, click ‘Review’ and ‘Submit’. Splunk is now capturing the syslog data sent by ClusterControl server. If there are new alarms raised by ClusterControl, you can retrieve them directly from Splunk > App > Search & Reporting and look up for “cmon-syslog-plugin” and you should see something like below:
Creating a Simple Alert with Splunk
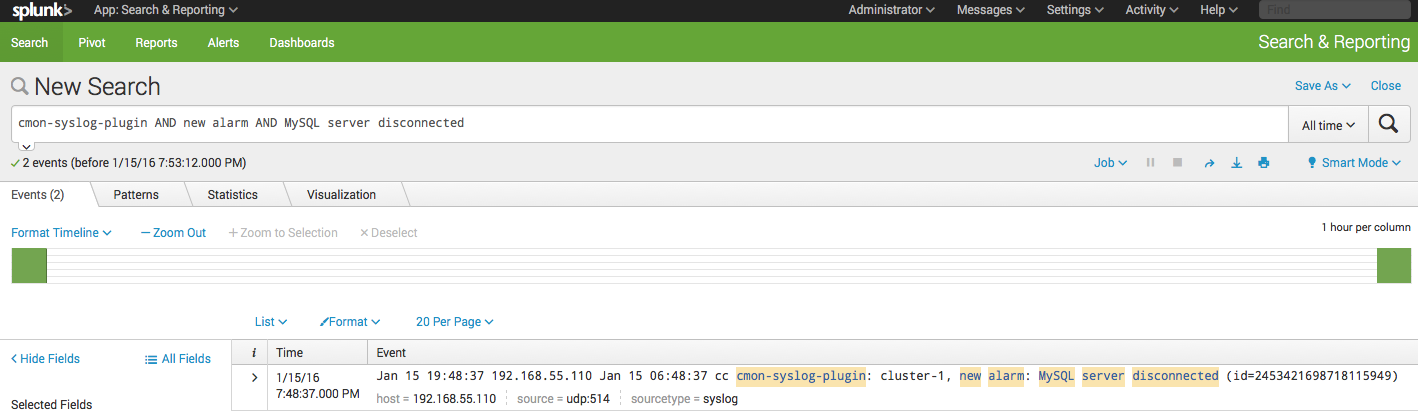
From the search result shown above, we can ask Splunk to send an alert if it finds a specific pattern in the incoming syslog. For example, to get an alert after a new alarm is raised when a MySQL server is down, use the following search term:
“cmon-syslog-plugin AND new alarm AND MySQL server disconnected”
You should get the following result (if the alarm is raised by ClusterControl):
Click on Save As > Alert and configure the settings with alert type ‘Real-time’:
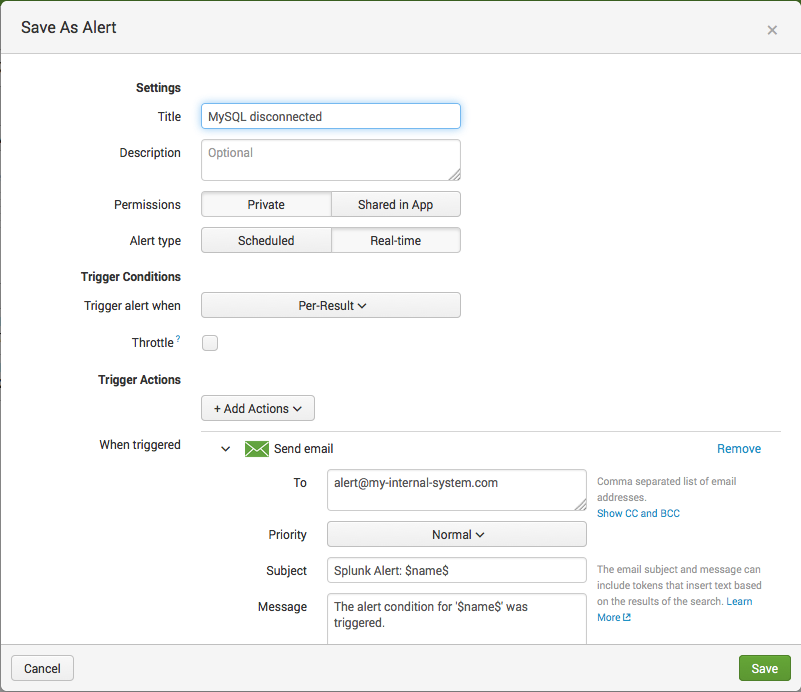
Click Save and you will get an alert if the same alarm raises again.
Splunk can also handle various alert actions like email, running a script, webhook and also through third-party apps integration like SMS alerting via Twillio, Slack notification, Twitter and more. The integration step above are similar if you are running on other log management tools like Logstash stack (with Kibana and ElasticSearch), SumoLogic or Loggly.
That’s it. Happy alerting!


