blog
How to use the ClusterControl Query Monitor for MySQL, MariaDB and Percona Server

The MySQL database workload is determined by the number of queries that it processes. There are several situations in which MySQL slowness can originate. The first possibility is if there is any queries that are not using proper indexing. When a query cannot make use of an index, the MySQL server has to use more resources and time to process that query. By monitoring queries, you have the ability to pinpoint SQL code that is the root cause of a slowdown.
By default, MySQL provides several built-in tools to monitor queries, namely:
- Slow Query Log – Captures query that exceeds a defined threshold, or query that does not use indexes.
- General Query Log – Captures all queries happened in a MySQL server.
- SHOW FULL PROCESSLIST statement (or through mysqladmin command) – Monitors live queries currently being processed by MySQL server.
- PERFORMANCE_SCHEMA – Monitors MySQL Server execution at a low level.
There are also open-source tools out there that can achieve similar result like mtop and Percona’s pt-query-digest.
How ClusterControl Monitors Queries
ClusterControl does not only monitor your hosts and database instances, it also monitors your database queries. It gets the information in two different ways:
- Queries are retrieved from PERFORMANCE_SCHEMA
- If PERFORMANCE_SCHEMA is disabled or unavailable, ClusterControl will parse the content of the Slow Query Log
ClusterControl starts reading from the PERFORMANCE_SCHEMA tables immediately when the query monitor is enabled, and the following tables are used by ClusterControl to sample the queries:
- performance_schema.events_statements_summary_by_digest
- performance_schema.events_statements_current
- performance_schema.threads
In older versions of MySQL (5.5), having PERFORMANCE_SCHEMA (P_S) enabled might not be an option since it can cause significant performance degradation. With MySQL 5.6 the overhead is reduced and even more so in 5.7. P_S offers great introspection of the server at an overhead of a few percents (1-3%). If the overhead is a concern then ClusterControl can parse the Slow Query log remotely to sample queries. Note that no agents are required on your database servers. It uses the following flow:
- Start slow log (during MySQL runtime).
- Run it for a short period of time (a second or couple of seconds).
- Stop log.
- Parse log.
- Truncate log (ClusterControl creates new log file).
- Go to 1.
As you can see, ClusterControl does the above trick when pulling and parsing the Slow Query log to overcome the problems with offsets. The drawback of this method is that the continuous sampling might miss some queries during steps 3 to 5. Hence, if continuous query sampling is vital for you and part of your monitoring policy, the best way is to use P_S. If enabled, ClusterControl will automatically use it.
The collected queries are hashed, calculated and digested (normalize, average, count, sort) and then stored in ClusterControl.
Enabling Query Monitoring
As mentioned earlier, ClusterControl monitors MySQL query via two ways:
- Fetch the queries from PERFORMANCE_SCHEMA
- Parse the content of MySQL Slow Query
Performance Schema (Recommended)
First of all, if you would like to use Performance Schema, turn it on all MySQL servers (MySQL/MariaDB v5.5.3 and later). Enabling this requires a MySQL restart. Add the following line to your MySQL configuration file:
performance_schema = ONThen, restart the MySQL server. For ClusterControl users, you can use the configuration management feature at Manage -> Configurations -> Change Parameter and perform a rolling restart at Manage -> Upgrades -> Rolling Restart.
Once enabled, ensure at least events_statements_current is enabled:
mysql> SELECT * FROM performance_schema.setup_consumers WHERE NAME LIKE 'events_statements%';
+--------------------------------+---------+
| NAME                           | ENABLED |
+--------------------------------+---------+
| events_statements_current      | YES     |
| events_statements_history      | NO      |
| events_statements_history_long | NO      |
+--------------------------------+---------+
Otherwise, run the following statement to enable it:
UPDATE performance_schema.setup_consumers SET ENABLED = 'YES' WHERE NAME = 'events_statements_current';MySQL Slow Query
If Performance Schema is disabled, ClusterControl will then default to the Slow Query log. Hence, you don’t have to do anything since it can be turned on and off dynamically during runtime via SET statement.
The Query Monitoring function must be toggled to on under ClusterControl -> Query Monitor -> Top Queries. ClusterControl will monitor queries on all database nodes under this cluster:

Click on the “Settings” and configure “Long Query Time” and toggle “Log queries not using indexes” to On. If you have defined two parameters (long_query_time and log_queries_not_using_indexes) inside my.cnf and you would like to use those values instead, toggle “MySQL Local Query Override” to On. Otherwise, ClusterControl will obey the former.
Once enabled, you just need to wait a couple of minutes before you can see data under Top Queries and Query Histogram.
How ClusterControl Visualizes the Queries
Under the Query Monitor tab, you should see the following three items:
-
Top Queries
-
Running Queries
-
Query Histogram
We’ll have a quick look at these here, but remember that you can always find more details in the ClusterControl documentation.
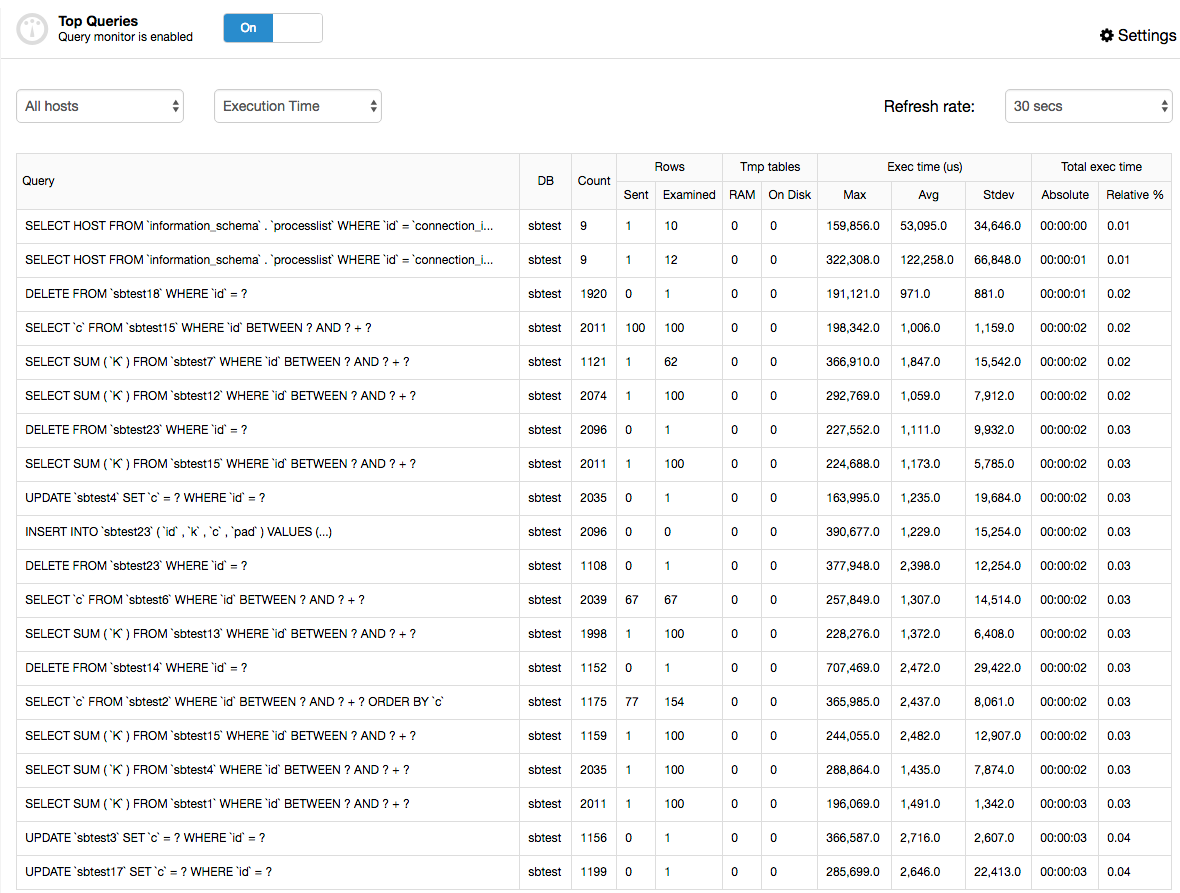
Top Queries
Top Queries is an aggregated list of all your top queries running on all the nodes of your cluster. The list can be ordered by “Occurrence” or “Execution Time”, to show the most common or slowest queries respectively. You don’t have to login to each of the servers to see the top queries. The UI provides an option to filter based on MySQL server.
If you are using the Slow Query log, only queries that exceed the “Long Query Time” will be listed here. If the data is not populated correctly and you believe that there should be something in there, it could be:
- ClusterControl did not collect enough queries to summarize and populate data. Try to lower the “Long Query Time”.
- You have configured Slow Query Log configuration options in the my.cnf of MySQL server, and “Override Local Query” is turned off. If you really want to use the value you defined inside my.cnf, probably you have to lower the long_query_time value so ClusterControl can calculate a more accurate result.
- You have another ClusterControl node pulling the Slow Query log as well (in case you have a standby ClusterControl server). Only allow one ClusterControl server to do this job.
The “Long Query Time” value can be specified to a resolution of microseconds, for example 0.000001 (1 x 10⁻⁶). The following shows a screenshot of what’s under Top Queries:
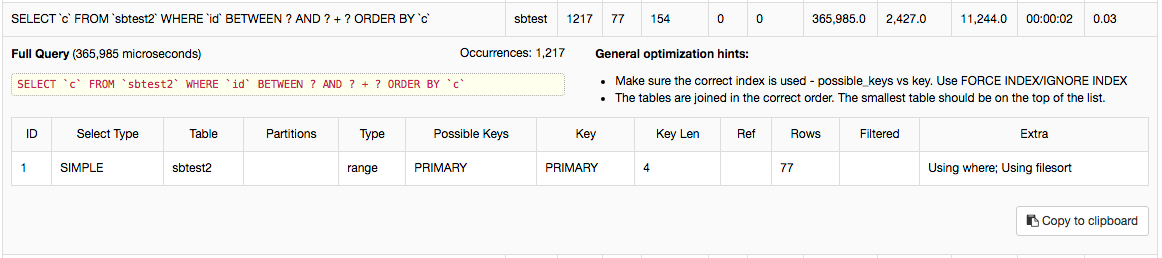
Clicking on each query will show the query plan executed, similar to EXPLAIN command output:
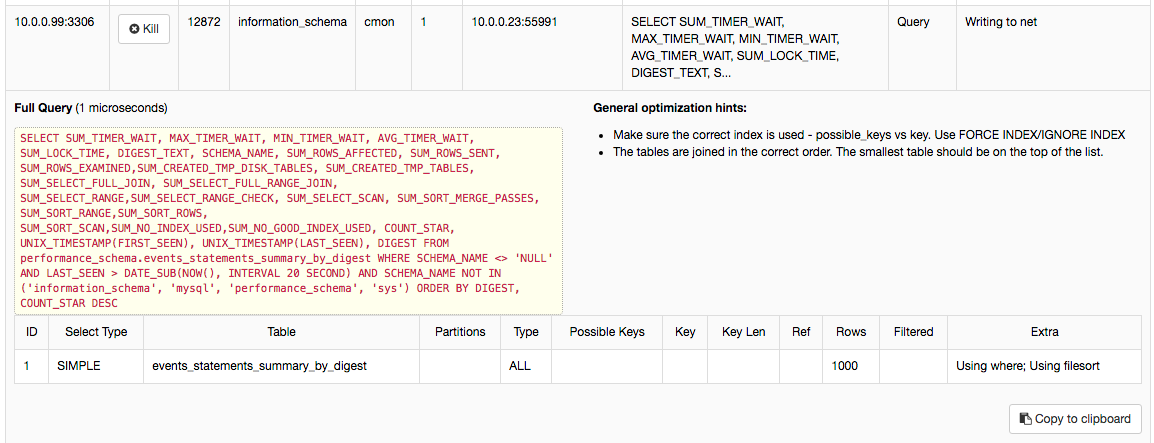
Running Queries
Running Queries provides an aggregated view of current running queries across all nodes in the cluster, similar to SHOW FULL PROCESSLIST command in MySQL. You can stop a running query by selecting to kill the connection that started the query. The process list can be filtered out by host.
Use this feature to monitor live queries currently running on MySQL servers. By clicking on each row that contains “Info”, you can see the extended information containing the full query statement and the query plan:
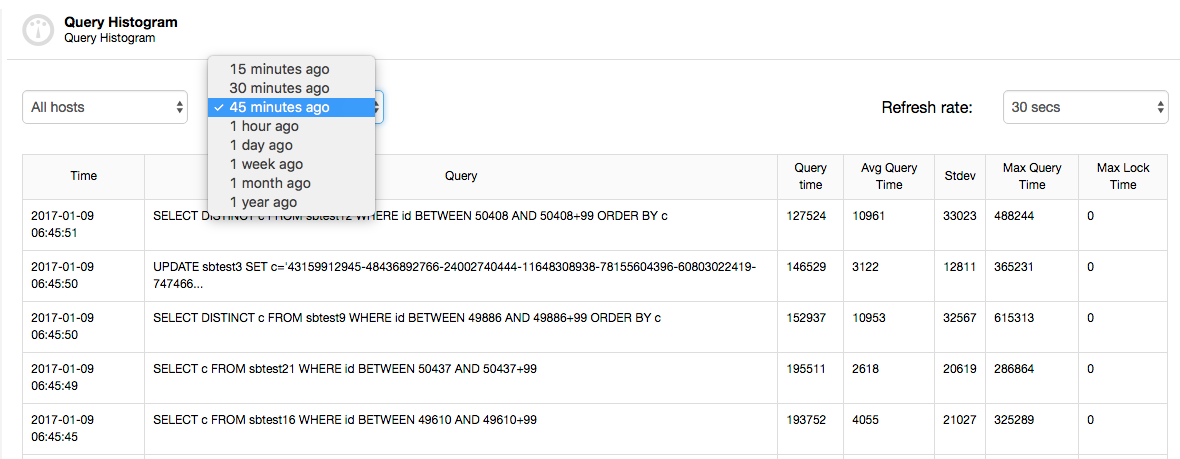
Query Histogram
The Query Histogram is actually showing you queries that are outliers. An outlier is a query taking longer time than the normal query of that type. Use this feature to filter out the outliers for a certain time period. This feature is dependent on the Top Queries feature above. If Query Monitoring is enabled and Top Queries are captured and populated, the Query Histogram will summarize these and provide a filter based on timestamp.
That’s all folks! Monitoring queries is as important as monitoring your hosts or MySQL instances, to make sure your database is performing well.


