blog
An Overview of Database Operational Reporting in ClusterControl

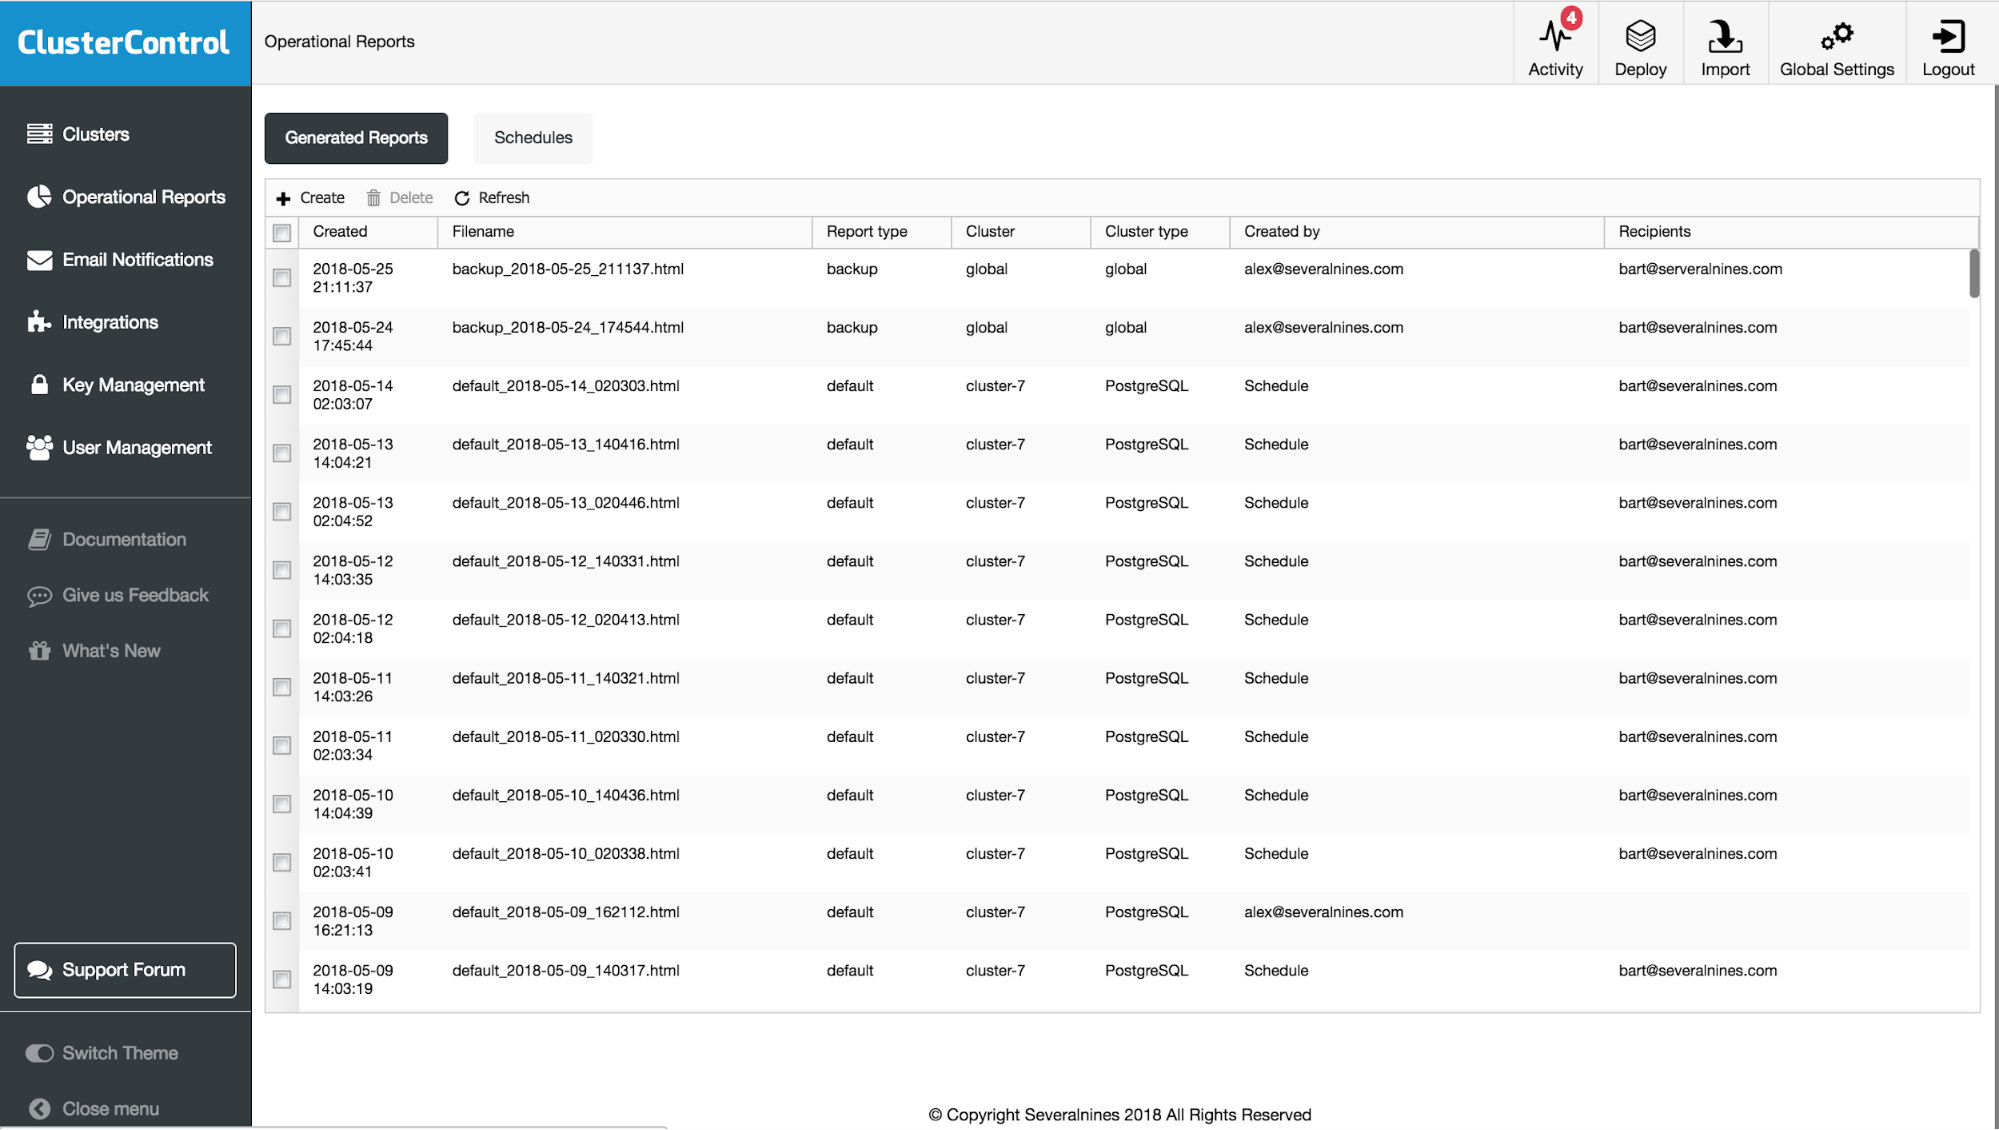
Operational Reporting provides support to the day-to-day enterprise activity monitoring and control. The purpose of this blog article is to get you more familiar with the operational reports available in ClusterControl.
ClusterControl operational reports arm you with information about your database infrastructure status, which you can use to audit your environment or as part of operational support. These reports consist of different checks and address various day-to-day DBA tasks. The idea behind ClusterControl operational reporting is to put all of the most relevant data into a single document which can be quickly analyzed in order to get a clear understanding of the status of the databases and its processes.
With ClusterControl you can schedule cross environment reports like “Daily System Report,” “Package Upgrade Report,” “Schema Change Report” as well as “Backups” and “Availability.” These reports will help you to keep your environment secure and operational. You will also see recommendations on how to fix gaps. Reports can be addressed to SysOps, DevOps or even managers who would like to get regular status updates about a given system’s health.
Why Do I Need Operational Reports?
You may already have an excellent monitoring tool with all possible metrics/graphs and you probably have also set up alerts based on metrics and thresholds (some will even have automated advisors providing them recommendations or fixing things automatically.) That’s good – having visibility into your system is important; nevertheless, you need to be able to process a lot of information. Integrated tools like ClusterControl have an advantage that all of the varying bits of information are located in the same place.
On smaller systems, you may want to do some manual checks, but in larger environments, it’s impossible to analyze everything in real time. It also sounds like a waste of time. To make sure your systems are in good shape, you’d need to go through quite a lot of information. Usually, that includes host statistics, database statistics, state of backups, logs and so forth.
What to Monitor and How Often?
Once you have all your database monitoring/management tools setup, you need to establish a routine to check the health of the databases. How often you’d like to do it is up to you and should be based on the size/workload of your environment or by your company’s or industry compliance standards. For smaller setups, daily checks will work. For larger configurations, you probably have to do it every week or so. The reasoning behind it is that regular tests should enable you to act proactively and fix any issues before they happen or become severe. Of course, you will eventually develop your pattern but here are some tips on what you may want to look.
What to monitor will be probably related to the role you play in your IT organization. DBA’s, DevOps, Developers or IT Management will each have different needs.
Operation Report Scheduler
Before we start describing particular operational reports let’s take a quick look at report scheduler. You can set up recurring automated reports based on your cluster name. Generation rate is divided into type daily, weekly, monthly. Each of them will give you the option to setup report as needed like every 5th day of the month for a monthly type or every Tuesday if you pick up Weekly reports.
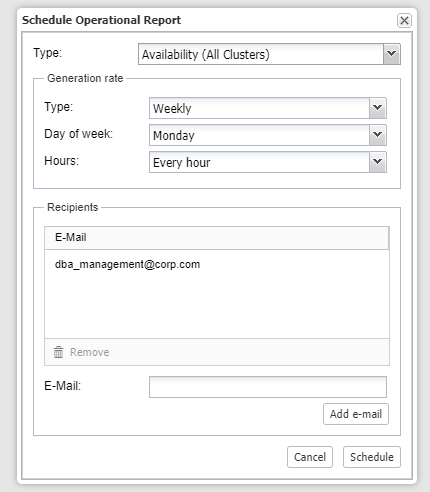
In the second section of the report scheduler, you can choose the recipients. It’s a good opportunity to set up some alerts for the managing team, then more technical ones for IT support. Scheduling this correctly can greatly take off tasks from IT, i.e., when management is asking for availability reports or security team needs to know packages version and schema changes.
Backup Report
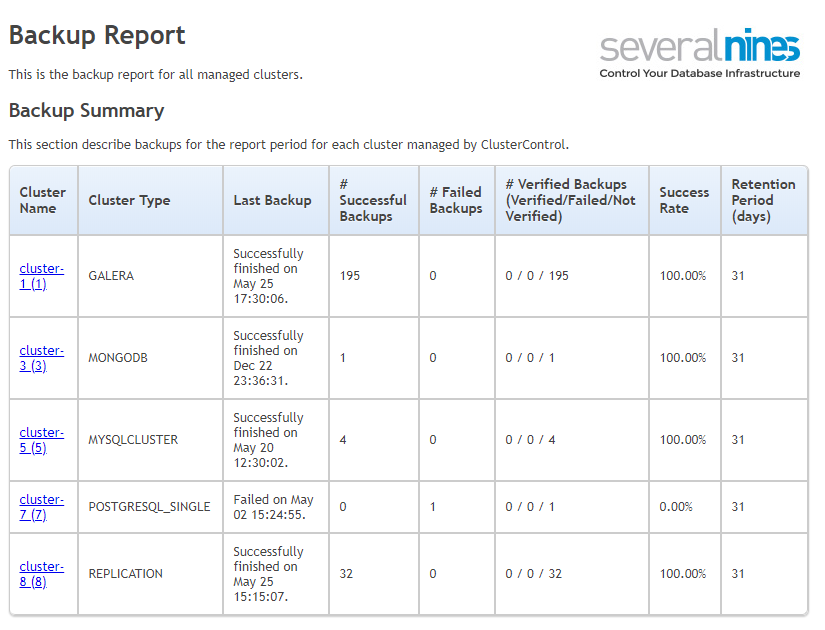
The Weekly Backup Report is an HTML report that provides an overview of backups for the reporting period for all managed clusters. The backup report is divided into two sections; backup summary and backup details.
In the main section of the report you can see the summary of all of your clusters with cluster type, last backup, failed and successful backups, success rate and retention period. What’s also important is that you will also see information about clusters with no backup set. It’s extremely helpful if you forget to set back up or if backups stopped working for some reason.
In the backup details, you can track a particular backup ID with detail information about location, size, time and method. We use the same templates with data for different database types so when you manage your mixed environment, you will get the same feel and look. It helps to manage different database backups better.
How does this solution work? We collect information on the backup process, the systems, platforms, and devices in the backup infrastructure when the backup job is triggered. All of that information is aggregated and stored in a CMON (ClusterControl repository database), so there is no need to query particular databases additionally.
Default Cluster Report
The Default Cluster Report holds all the detailed information about a particular cluster. It starts with a review of various alerts which are related to the cluster group.
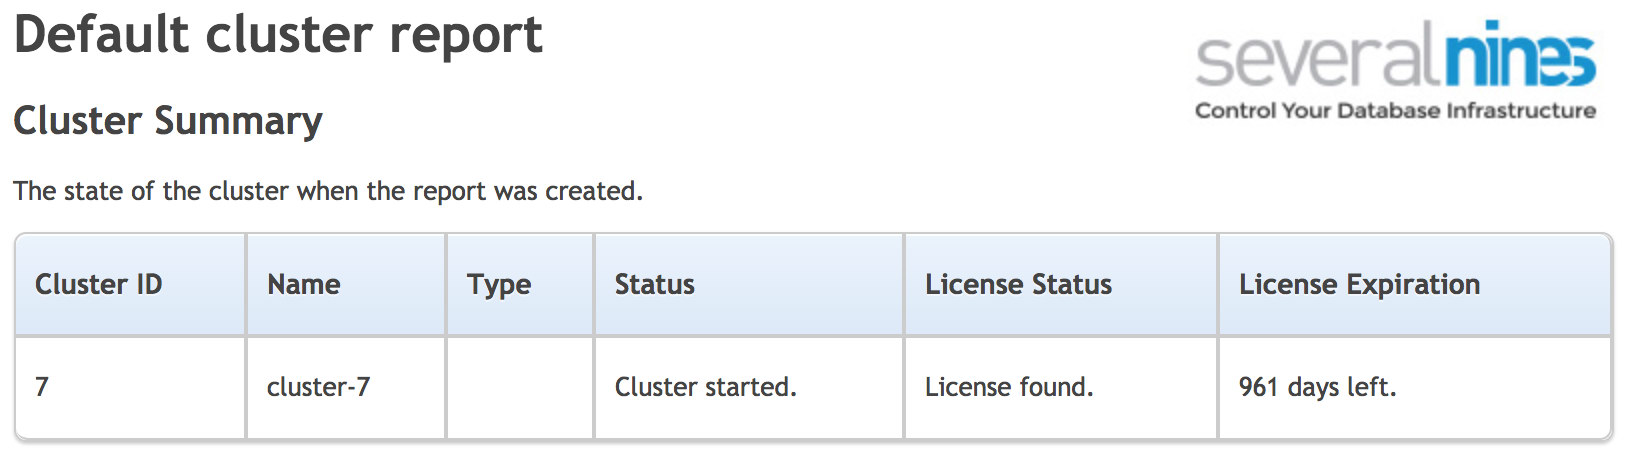
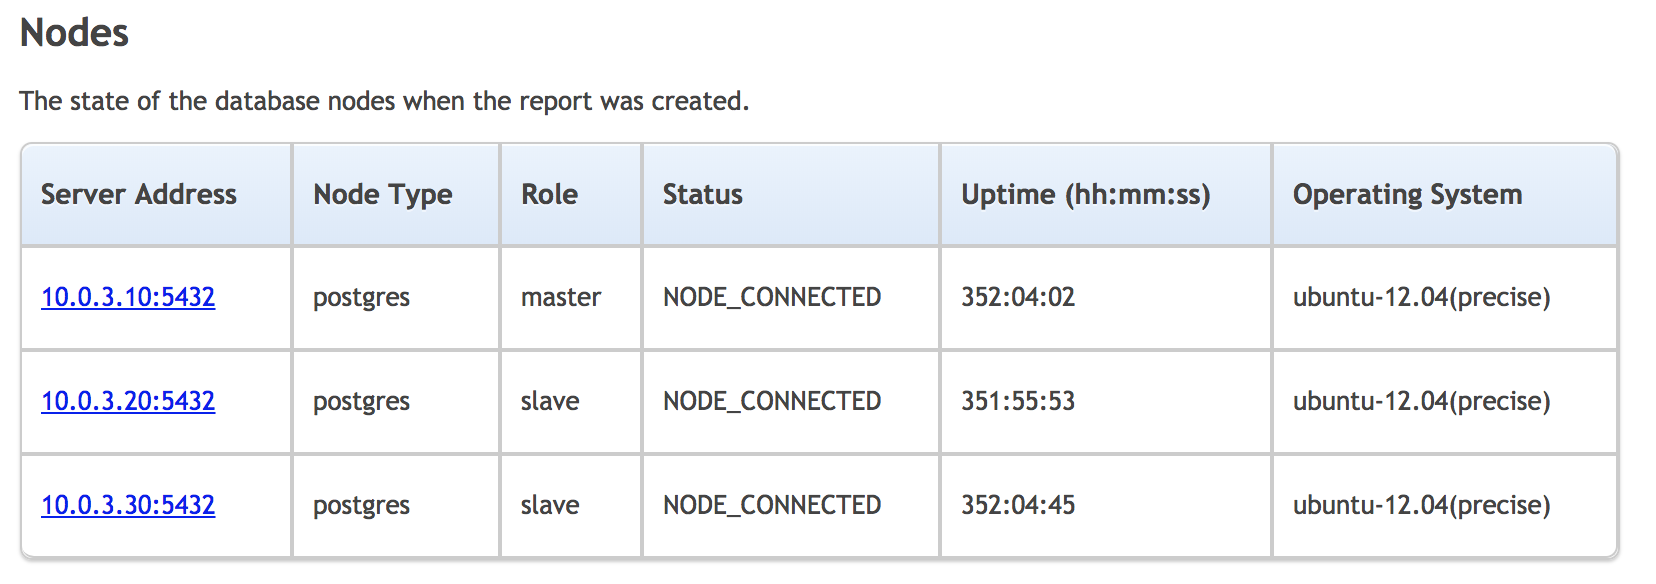
Next section is about the state of the nodes that are part of the cluster. You have a list of the nodes in the cluster, their type, role (master or slave), the status of the node, uptime and the OS.
Another section of the report is the backup summary, same as we discussed above.
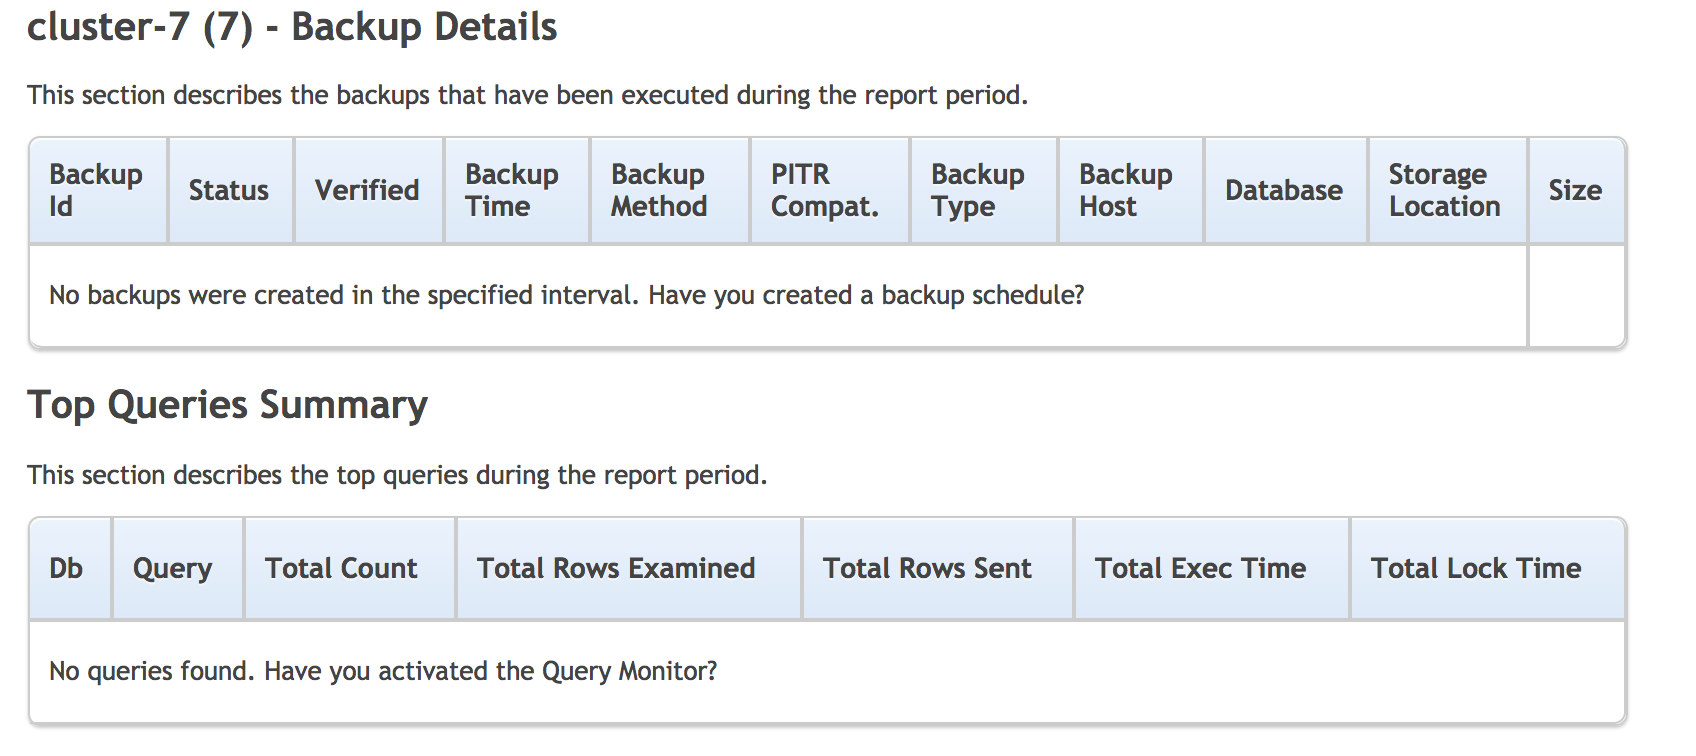
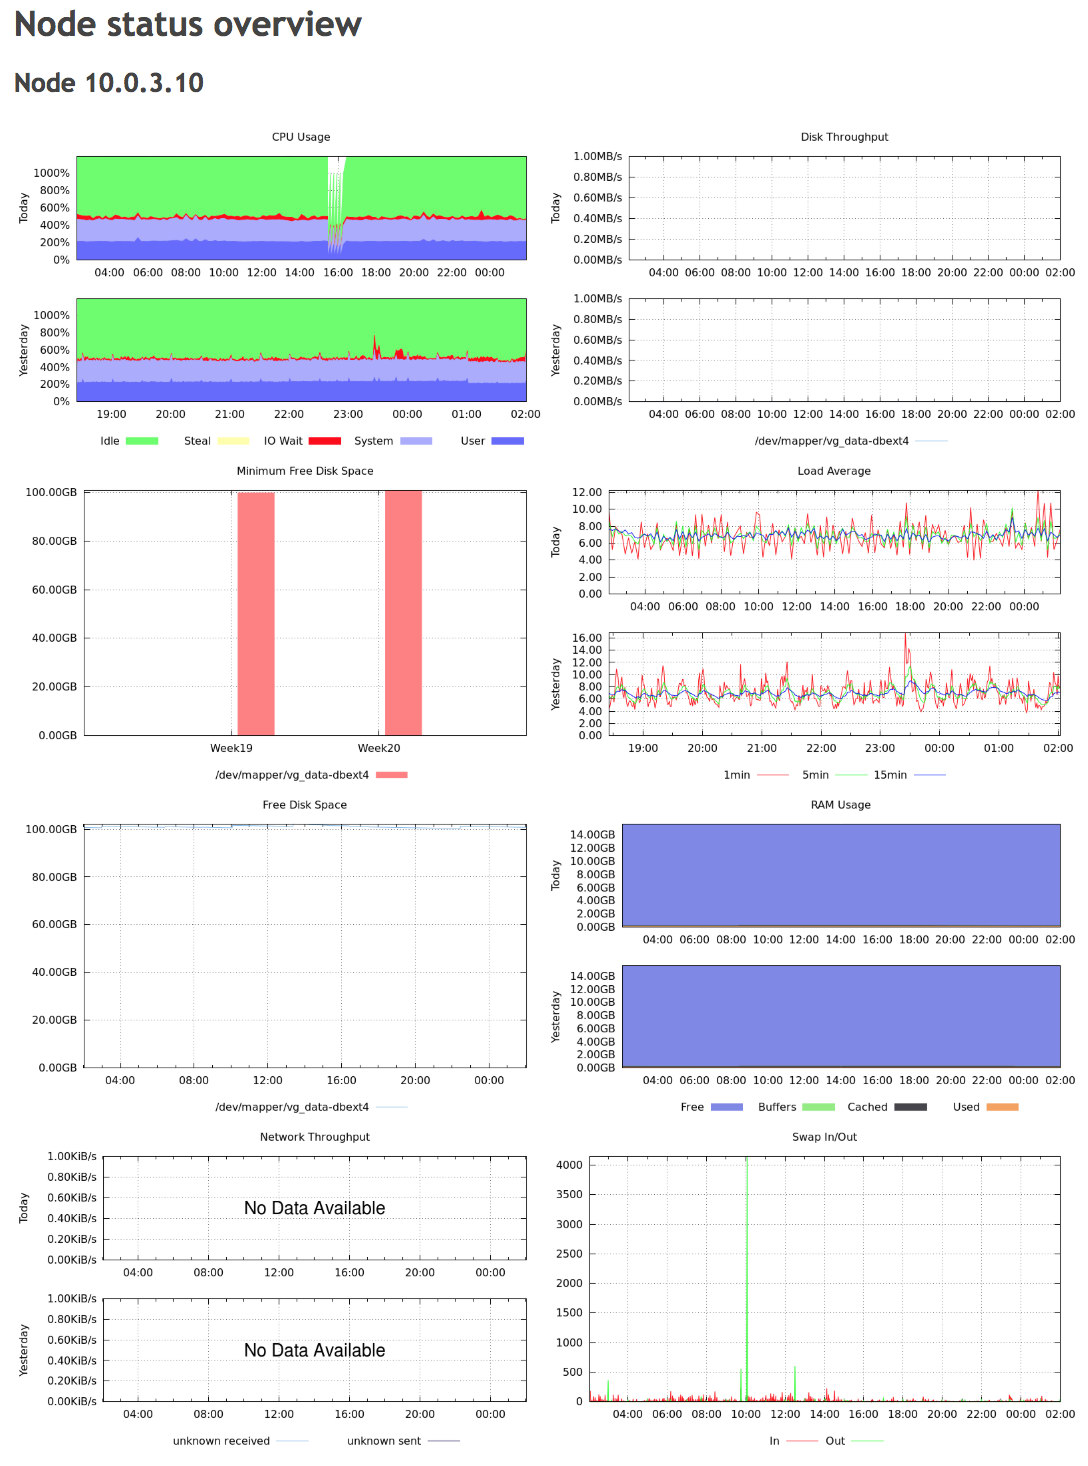
Next one presents a review of top queries in the cluster. Finally, we see a “Node status overview” in which you’ll be given with graphs related to OS and MySQL metrics for each node.

Upgrade Report
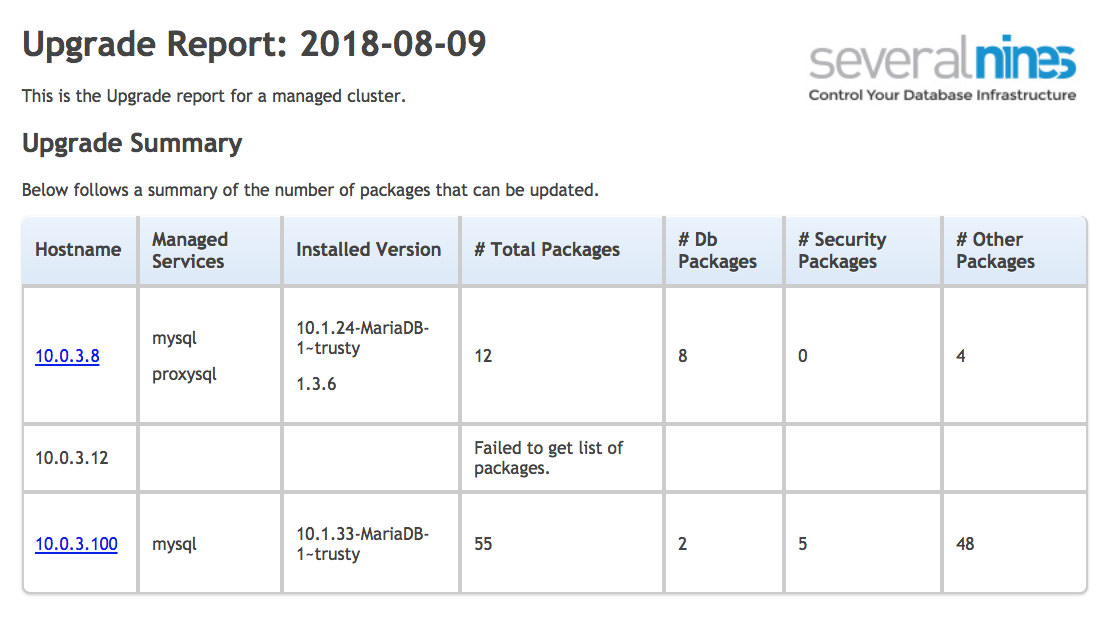
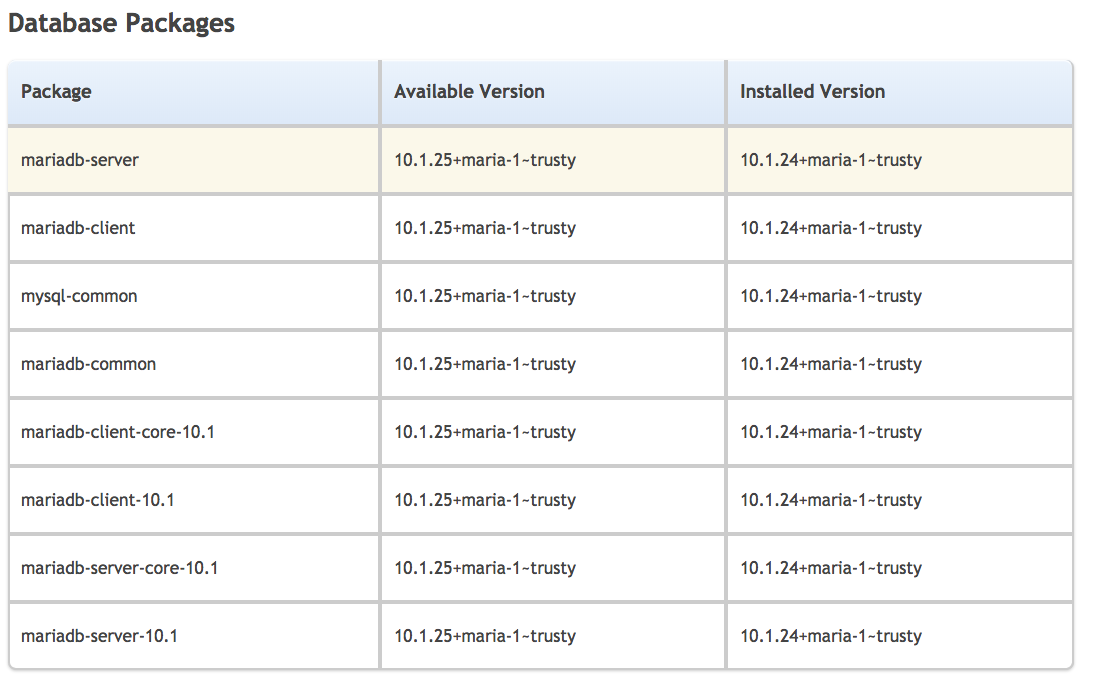
This cluster report will help you to keep your packages up-to-date and secure. The Upgrade Report gathers information from the operating system and compares them to packages available in the repository.
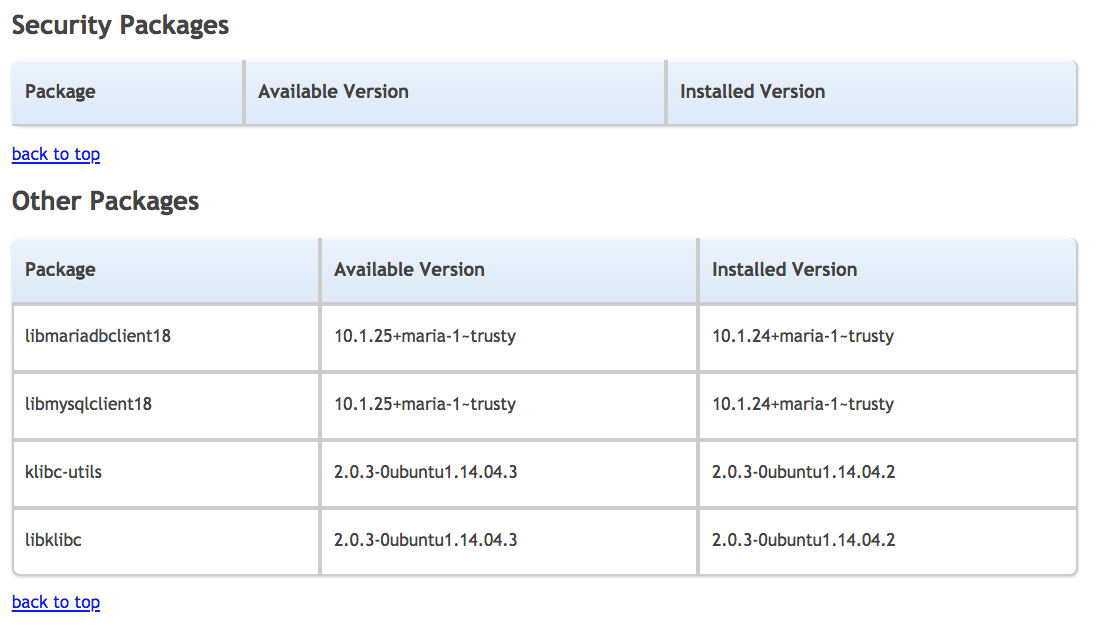
The report is divided into four sections; upgrade summary, database packages, security packages, and other packages. You can quickly compare what you have installed on your system and find a recommended upgrade or patch.
Schema Change Detection Report
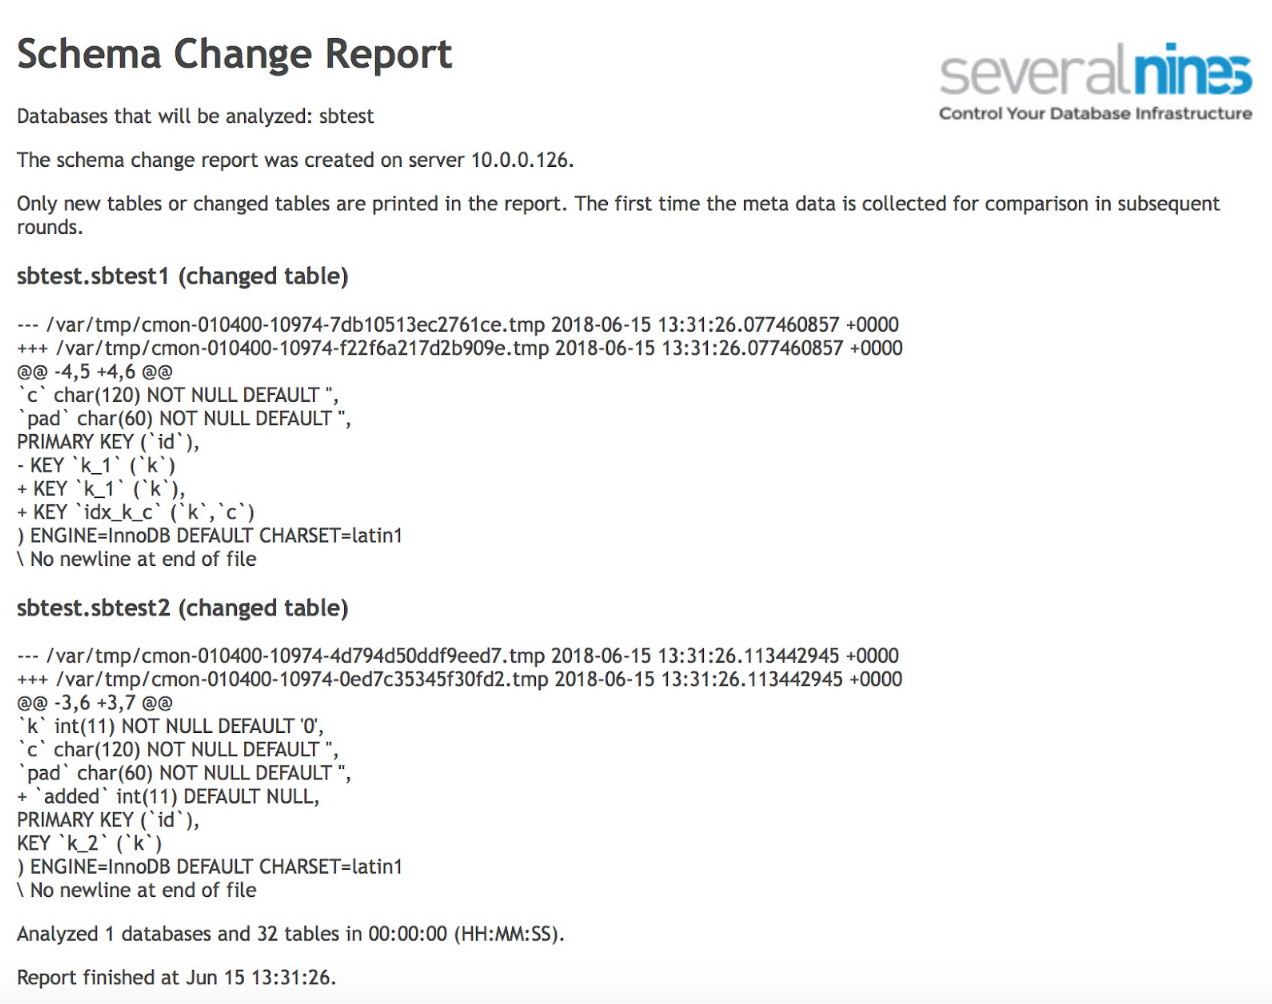
The Schema Change Detection Report shows any DDL changes on your database. To work correctly it requires an additional parameter in ClusterControl configuration file. If this is not set you will see following information: schema_change_detection_address is not set in /etc/cmon.d/cmon_1.cnf. Once that is in place an example output may be like below:
Availability Report
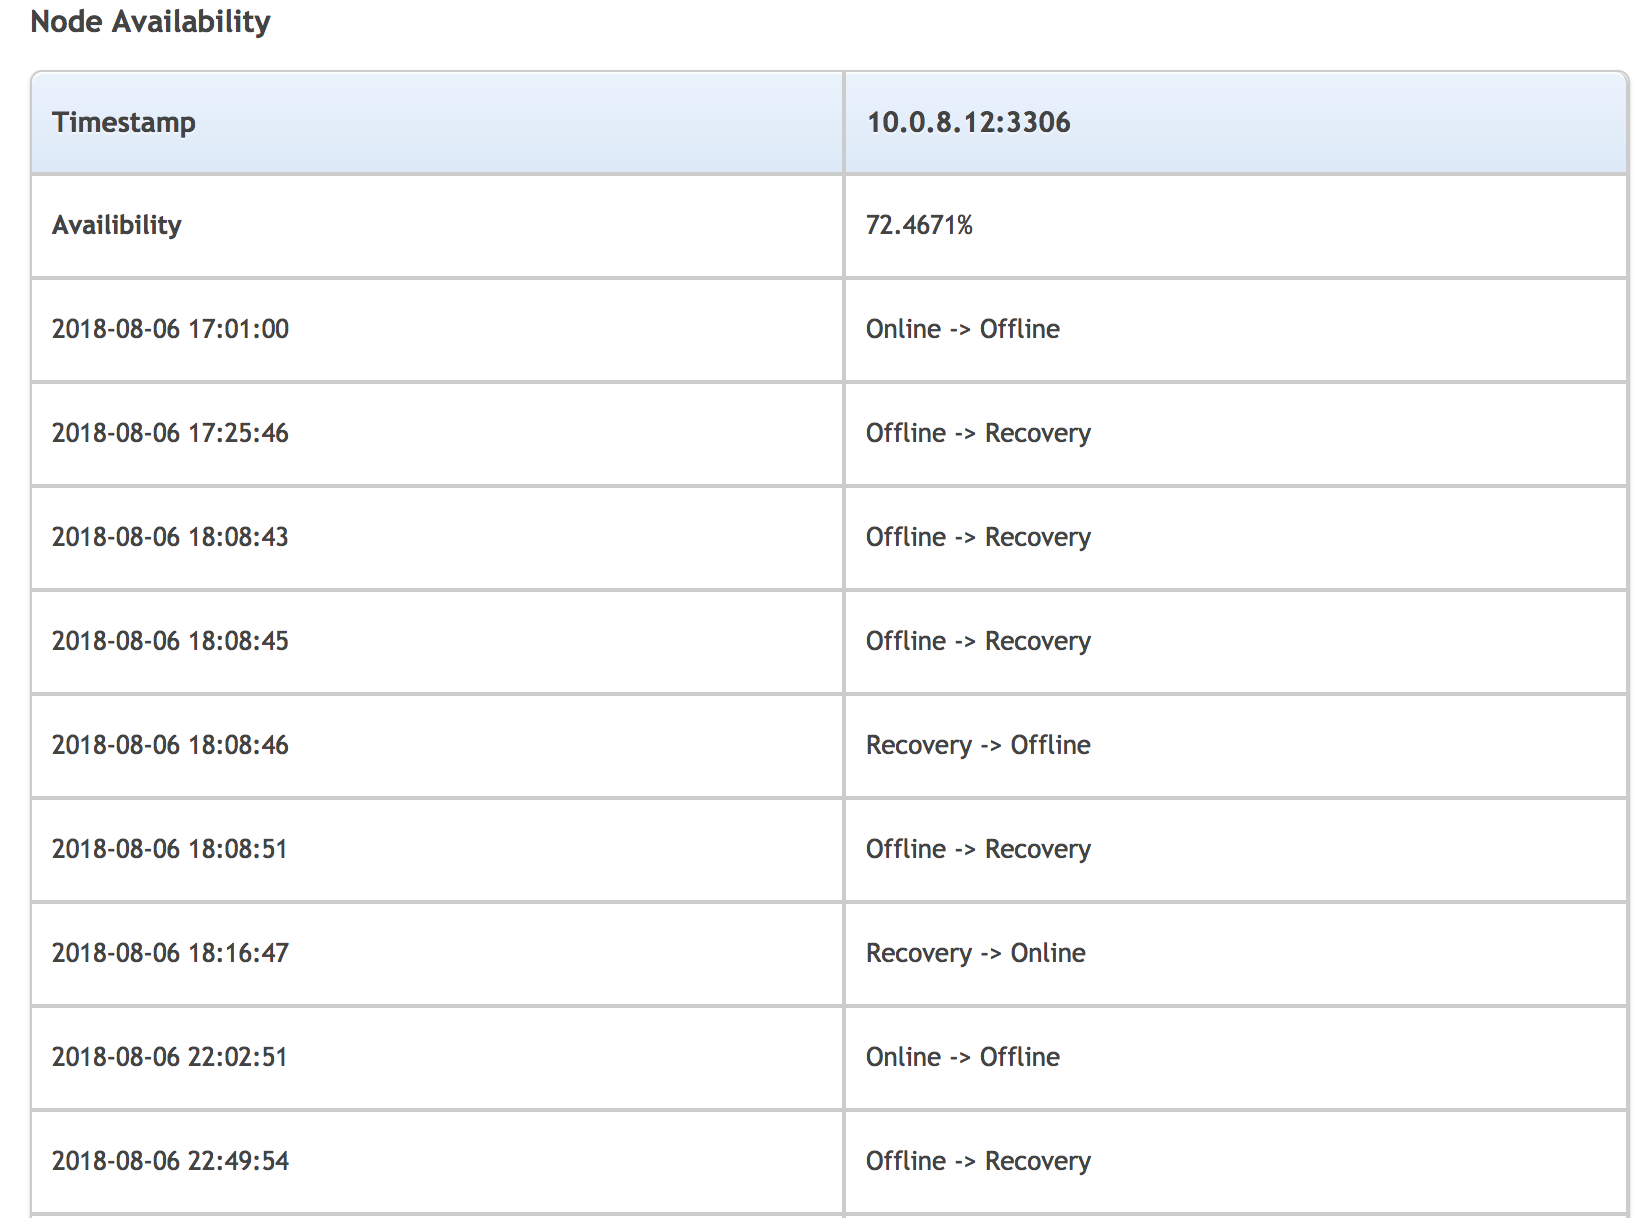
Last but not least is the Availability Report. Availability is notoriously hard to measure and report on, although it is an important KPI in any SLA between you and your customer. With that in mind, we created a report which can measure you database uptime. The script is put into your account during planned maintenance which you can set in ClusterControl. Based on the report information you can see if you are in line with your internal or external SLA and plan changes in database infrastructure to keep your planned nines.
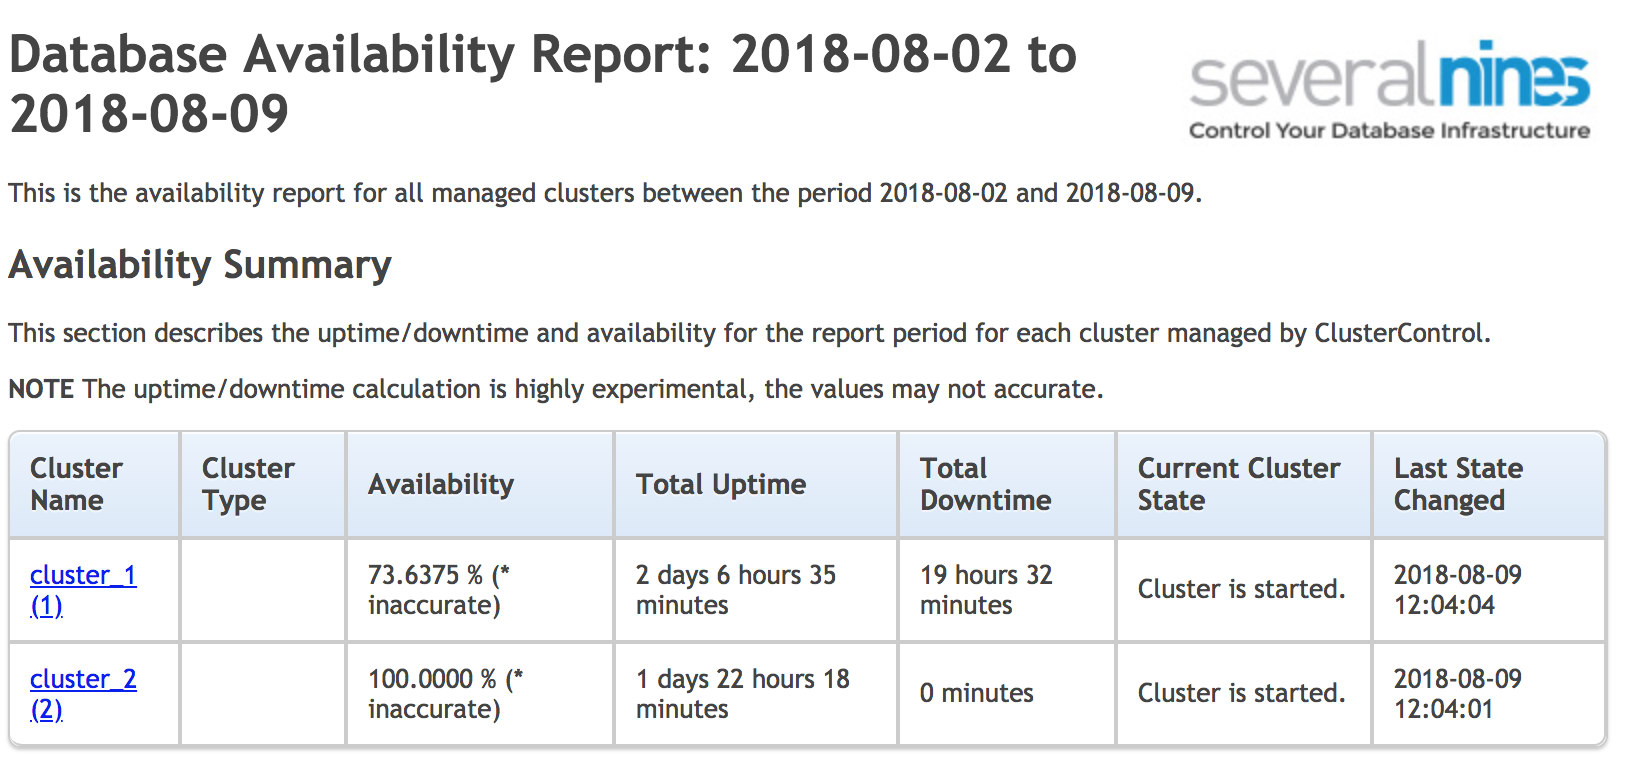
The main section of the report describes the uptime/downtime and availability for the reporting period for each cluster managed by ClusterControl. The information is combined for all cluster regardless of the cluster type.
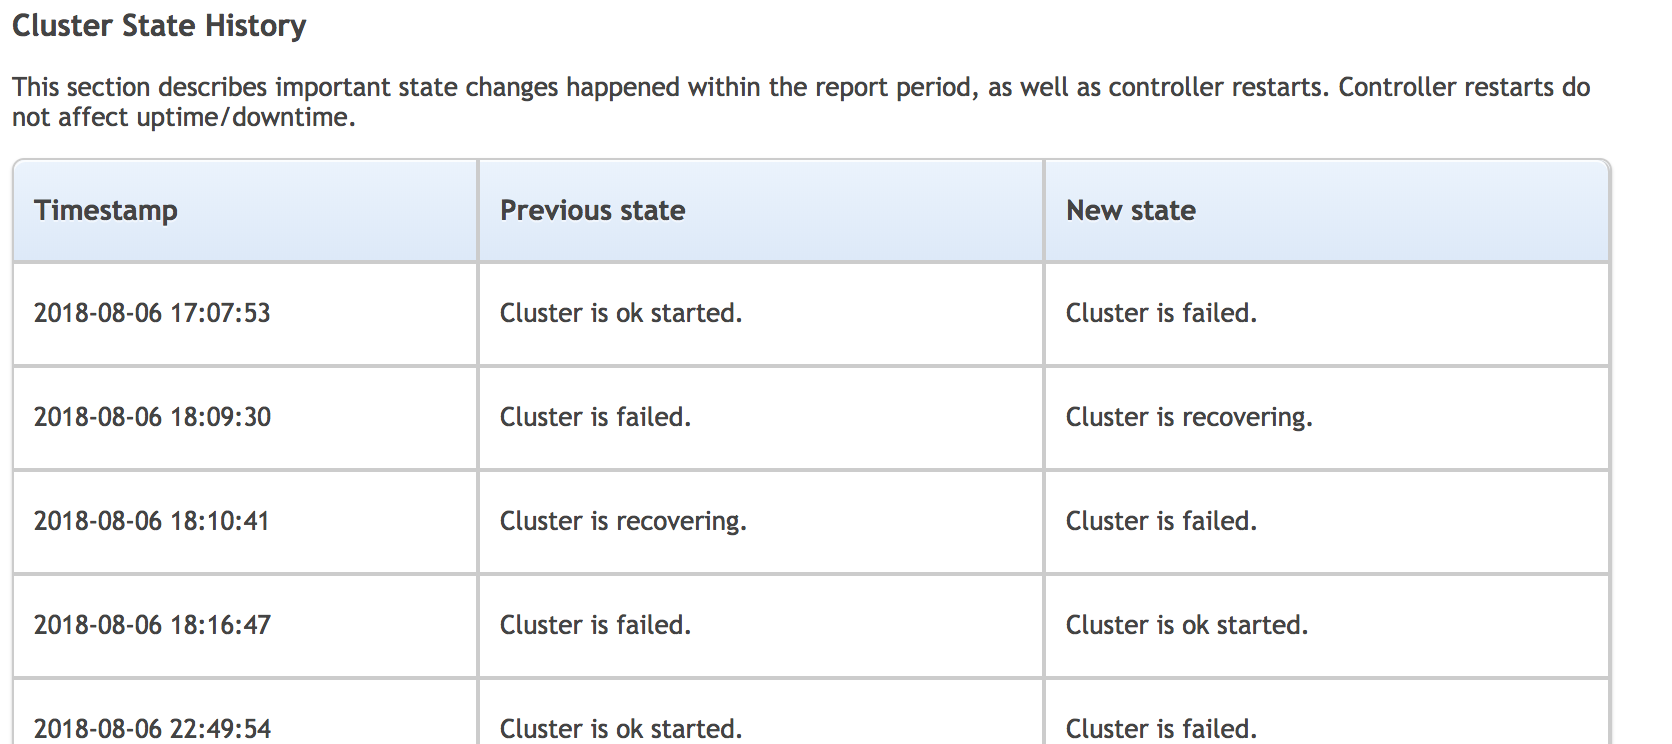
Down below in details you can see important state changes happened within the reporting period, as well as controller restarts. Controller restarts do not affect uptime or downtime and planned maintenance will be not counted into the report.
Conclusion
Severalnines ClusterControl can help you cover several aspects of your database system compliance. Starting with backup history details, which you can use to track things like backup completion, history and servers without a proper backup policy to package upgrade reports with outdated system packages and schema changes. With a few steps, you can schedule enterprise level checks on your open source databases. All of this will give your management and support teams better insight into your DB operations.