blog
Scaling with elasticsearch: use cases
Elasticsearch Ability To Scale
We scale database clusters for many reasons; primarily, we do so to spread the load amongst the cluster peers. Scaling can be done up or out. Scaling up is what is commonly also known as vertical scaling. This approach is where you add more hardware resources such as CPU, RAM, or disk to your existing hardware — either a physical or virtual machine. Scaling out, also known as horizontal scaling, is where you add more database nodes, such as shards, replicas, or pods, to spread out the load by passing it to a newer node.
Certain specifications and skills are required in Elasticsearch when scaling your cluster.
By nature, Elasticsearch is designed to always be available and easily scalable, e.g., there is no need for application clients to be modified. Horizontal scaling with Elasticsearch is done automatically as it distributes the load evenly and your data can be queried or retrieved when it’s necessary after it has been established as ready in the cluster. Elasticsearch knows how to balance multi-node clusters to provide scale and high availability.
For production Elasticsearch, especially with humongous amounts of data, it is best to set it up as a cluster, requiring at least three nodes, as it utilizes quorum-based decision-making. Let’s get into scaling details.
How does Elasticsearch scale?
Elasticsearch stores your data on at least a primary and a replica shard by default. So if your cluster node goes down, your data is still available on another node for retrieval, and it is not lost. Scalability-wise, adding a node to an existing cluster is feasible. Once a new node is set up, you can have it join the existing cluster, and Elasticsearch will automatically allocate new shards, so your data will have to be expanded.
Under the hood, Elasticsearch operates data in an index manner. This means that the data that can be represented as a document is stored in an indexed fashion and is fully searchable in real-time. Elasticsearch uses a data structure called an inverted index that supports very fast full-text searches. An inverted index lists every unique word that appears in any document and identifies all of the documents in which each word occurs.
Elasticsearch indexes are logically grouped into one or more physical shards with documents distributed across multiple shards, ensuring redundancy and protecting against faults such as hardware failure. Loads are also distributed, promoting speed during search or retrieval. Elasticsearch can also rebalance its data tiers such as migrating shards into nodes with lower heap size. In fact, when you add a new node or a node fails, Elasticsearch automatically rebalances the index’s shards across the data tier’s or cluster’s remaining nodes.
Types of shards in Elasticsearch
Shards in Elasticsearch are divided into two types — primary and replica shards.
- Primary Shard. Each document in an index belongs to one primary shard. The number of primary shards in an index is fixed at the time an index is created.
- Replica Shard. A replica shard is a copy of a primary shard. The number of replica shards can be changed at any time, without interrupting indexing or query operations.
Replicas provide redundant copies of your data to protect against hardware failure and increase capacity to serve read requests like searching or retrieving a document. Elasticsearch data is stored in an index split into a number of shards, which distribute data around a cluster. To achieve high availability, these shards are replicated and distributed across the cluster.
How does Elasticsearch store data in the cluster?
By default, Elasticsearch assigns the default value of 1 for both of the following options:
- number_of_shards. The value of this setting determines the number of primary shards in the target index.
- number_of_replicas. The value of this setting determines the number of replica shards per primary shard in the target index.
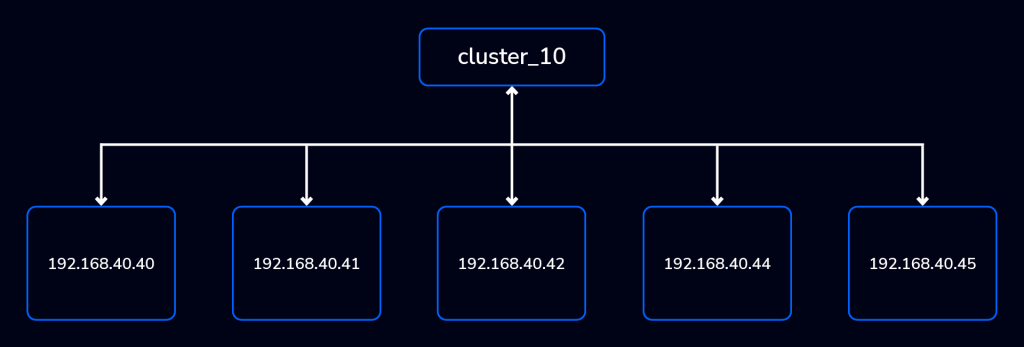
Let’s create a cluster and an index. First, you can see how my cluster_10 splits node responsibilities.
GET /_cat/nodes?v=true&h=id,ip,port,hm,rp,r,m,
id   ip            port    hm rp r  m
AZoW 192.168.40.41 9300 908mb 92 dm *
cX0x 192.168.40.42 9300 908mb 93 dm -
v_b5 192.168.40.40 9300 908mb 92 dm -
qV10 192.168.40.44 9300 908mb 92 d  -
ECYK 192.168.40.45 9300 908mb 92 d  -
The first three nodes are data and master eligible while the last two (192.168.40.44 and 192.168.40.45) are data-only. Referring to the above, you can see the assignments where d stands for data and dm stands for data and master eligible. The * signifies the current assigned master of the cluster.
Now, I have created an index named pharm-groc-002 considering I have a total of 5 entries.
POST pharm-groc-002/_doc/5
{
    "dog_title": "Buraisins",
    "age": 5,
    "characteristics": "cutest wolf in the planet",
    "text_entry": "She will bite and devour wood... like a wood pecker",
    "color": "gray, black, and some white"
}
This is executed directly, meaning it shall have default values if we verify the index’s settings.
Let’s check and verify.
GET /pharm-groc-002/_settings?format=yaml
---
pharm-groc-002:
  settings:
    index:
      routing:
        allocation:
          include:
            _tier_preference: "data_content"
      number_of_shards: "1"
      provided_name: "pharm-groc-002"
      creation_date: "1680247727243"
      number_of_replicas: "1"
      uuid: "Z_RztchZQbqPORdKKrs3AQ"
      version:
        created: "8030199"
As you can see, the values are set by default for the following number_of_shards and number_of_replicas options. This means that data is dispersed in 2 shards, i.e., 1 primary and 1 replica shard. Let’s verify that how it is stored:
GET _cat/shards/pharm-groc-002?h=index,shard,pr,state,unassigned.reason,ip,id,sto,d,n,cs,mc,md,mts&format=json
[
  {
    "index": "pharm-groc-002",
    "shard": "0",
    "pr": "r",
    "state": "STARTED",
    "unassigned.reason": null,
    "ip": "192.168.40.41",
    "id": "AZoWPnNNRFSRyUt8m_hafw",
    "sto": "14.7kb",
    "d": "5",
    "n": "192.168.40.41",
    "cs": "0b",
    "mc": "0",
    "mts": "0b"
  },
  {
    "index": "pharm-groc-002",
    "shard": "0",
    "pr": "p",
    "state": "STARTED",
    "unassigned.reason": null,
    "ip": "192.168.40.44",
    "id": "qV10-kmTTiyaFR-YMj-8VA",
    "sto": "14.7kb",
    "d": "5",
    "n": "192.168.40.44",
    "cs": "0b",
    "mc": "0",
    "mts": "0b"
  }
]
This is equally balanced, and you’ll notice the sto (disk space used by the shard) shows data stored from the primary and on the replica. The data is only assigned two nodes 192.168.40.41 and 192.168.40.44.
Now, let’s make a new document that can be designed to be much more dispersed.
PUT /pharm-mintal-004
{
  "settings": {
    "index": {
      "number_of_shards": 3,
      "number_of_replicas": 2
    }
  }
}
Verifying its options.
GET pharm-mintal-004/_settings?filter_path=*.*settings.*index.number*
{
  "pharm-mintal-004": {
    "settings": {
      "index": {
        "number_of_shards": "3",
        "number_of_replicas": "2"
      }
    }
  }
}
Now, this is how our shards look:
GET _cat/shards/pharm-mintal-004?h=index,shard,pr,state,unassigned.reason,ip,id,sto&format=text
pharm-mintal-004 0 p STARTED  192.168.40.42 cX0xd_82Ry-MHtK8KWAnIQ 225b
pharm-mintal-004 0 r STARTED  192.168.40.40 v_b50Z2DQYebJEKegMtv6g 225b
pharm-mintal-004 0 r STARTED  192.168.40.44 qV10-kmTTiyaFR-YMj-8VA 225b
pharm-mintal-004 1 r STARTED  192.168.40.41 AZoWPnNNRFSRyUt8m_hafw 225b
pharm-mintal-004 1 p STARTED  192.168.40.40 v_b50Z2DQYebJEKegMtv6g 225b
pharm-mintal-004 1 r STARTED  192.168.40.45 ECYKZ1zkQ0aCLzSx-lJcHg 225b
pharm-mintal-004 2 r STARTED  192.168.40.42 cX0xd_82Ry-MHtK8KWAnIQ 225b
pharm-mintal-004 2 p STARTED  192.168.40.45 ECYKZ1zkQ0aCLzSx-lJcHg 225b
pharm-mintal-004 2 r STARTED  192.168.40.44 qV10-kmTTiyaFR-YMj-8VA 225b
There are three primary shards that the pharm-mintal-004 shall be dispersed with 2 replicas for each. For example, 192.168.40.42 is on a 0 primary shard and replica shards 192.168.40.40 and 192.168.40.44. In case node 192.168.40.42 shard encounters hardware failure, replicas from 192.168.40.40 and 192.168.40.44 can take over as the primary shard. Apart from 0 shard, it has 1 and 2 shards which compliments the 3 primary shards we set upon index creation. Elasticsearch will also ensure that primary and replica shards are assigned into different nodes during segmentation. For example, shard 2’s primary is pointed to 192.168.40.45, while its replicas are on nodes 192.168.40.42 and 192.168.40.44.
Elasticsearch can customize routing abilities to determine where your document shall be stored. Now consider, I have inserted index using and not routing.
POST pharm-mintal-004/_doc/?routing=bukokies
{
    "user": {
      "id" : "bukokies"
    },
    "type": "Beagle Terrier",
    "age": 7,
    "characteristics": "One of the smartest but famous face in hollywood",
    "fave_food": "beef meat",
    "color": "light brown"
}

POST pharm-mintal-004/_doc/2
{
    "user": {
      "id" : "buraisins"
    },
    "type": "Terrier mixed with Beagle",
    "age": 5,
    "characteristics": "Looks like Togo but funny face",
    "fave_food": "annnyyything..",
    "color": "grey, black, a bit of white"
}
Consider the following sample results of this entry when executed,
{
  "_index": "pharm-mintal-004",
  "_id": "1",
  "_version": 1,
  "result": "created",
  "_shards": {
    "total": 3,
    "successful": 3,
    "failed": 0
  },
  "_seq_no": 1,
  "_primary_term": 1
}
which demonstrates 3 successful writes that are dispersed across 3 primary shards.
Now, let’s check the metrics of our shards for this document we created.
GET _cat/shards/pharm-mintal-004?h=index,shard,pr,state,unassigned.reason,ip,id,sto
pharm-mintal-004 0 p STARTED  192.168.40.42 cX0xd_82Ry-MHtK8KWAnIQ    8kb
pharm-mintal-004 0 r STARTED  192.168.40.40 v_b50Z2DQYebJEKegMtv6g    8kb
pharm-mintal-004 0 r STARTED  192.168.40.44 qV10-kmTTiyaFR-YMj-8VA    8kb
pharm-mintal-004 1 r STARTED  192.168.40.41 AZoWPnNNRFSRyUt8m_hafw  7.3kb
pharm-mintal-004 1 p STARTED  192.168.40.40 v_b50Z2DQYebJEKegMtv6g  7.3kb
pharm-mintal-004 1 r STARTED  192.168.40.45 ECYKZ1zkQ0aCLzSx-lJcHg  7.3kb
pharm-mintal-004 2 r STARTED  192.168.40.42 cX0xd_82Ry-MHtK8KWAnIQ    8kb
pharm-mintal-004 2 p STARTED  192.168.40.45 ECYKZ1zkQ0aCLzSx-lJcHg 17.1kb
pharm-mintal-004 2 r STARTED  192.168.40.44 qV10-kmTTiyaFR-YMj-8VA    8kb
Our sample data is not completely balanced as we mixed custom routing with the default routing that Elasticsearch does automatically. Going forward, we’ll explain how this relates to scaling Elasticsearch.
Retrieving data from Elasticsearch
Based on the data we have, Elasticsearch will retrieve our document pharm-mintal-00 as follows:
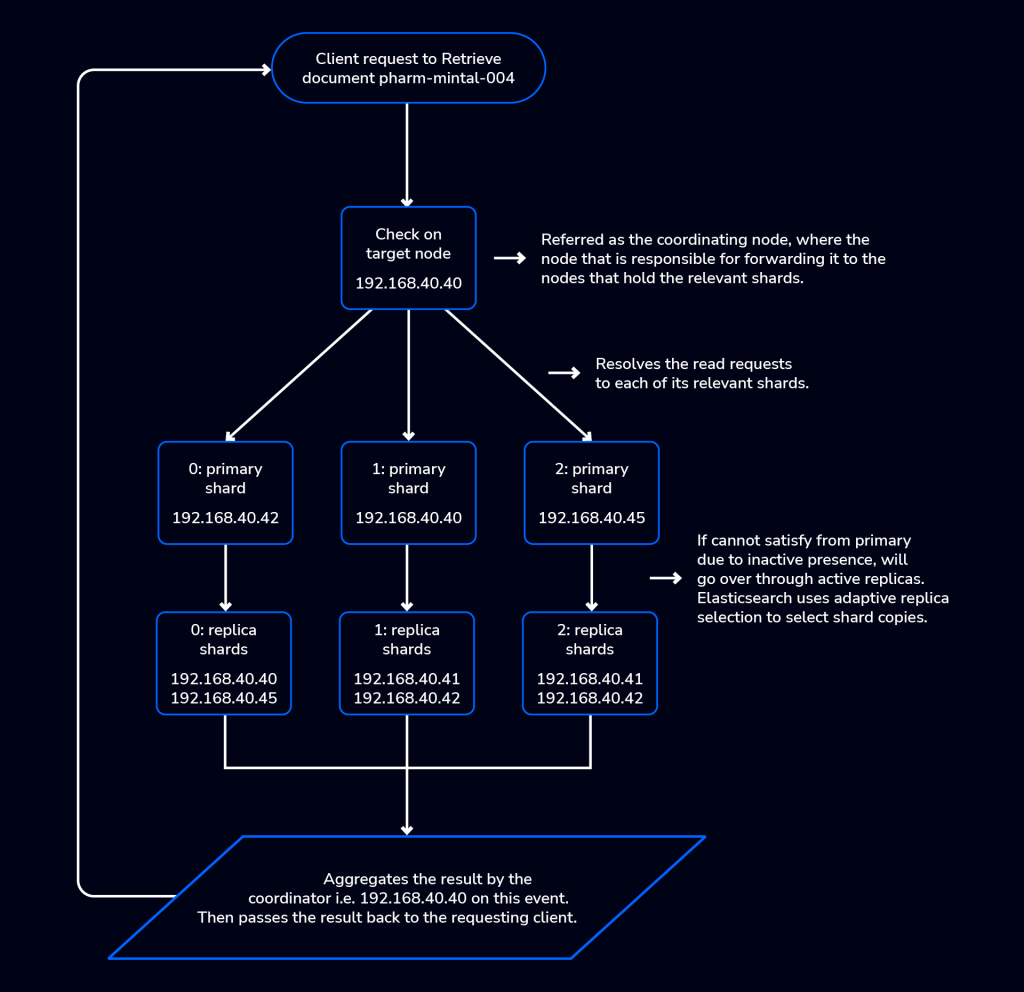
Given that your Elasticsearch cluster is scaled, imagine if you have a gazillion number of documents or data to retrieve. It would be a problem if it’s not dispersed properly, and in fact, large shards take longer to recover after a failure. Remember, one of the reasons we scale is to spread the load so we avoid unwanted failure, especially when your application is reliant on your database to be under full operational availability.
Planning to scale your Elasticsearch cluster
Elasticsearch recommends to plan your shard sizes between 10GiB and 50GiB. As stated earlier, larger shards take longer to recover after a failure. When a node fails, Elasticsearch rebalances the node’s shards across the data tier’s remaining nodes. This recovery process typically involves copying the shard contents across the network, so a 100GB shard will take twice as long to recover as a 50GB one. In contrast, small shards carry proportionally more overhead and are less efficient to search. Searching fifty 1GB shards will take substantially more resources than searching a single 50GB shard containing the same data.
Although there are no hard limits on shard size, Elasticsearch claims that between 10GB and 50GB typically work well for logs and time series data. You may be able to use larger shards depending on your network and use case. Smaller shards may be appropriate for Enterprise Search and similar use cases.
When scaling your cluster, monitoring your shards is very important. If you find out that too many shards are allocated to a specific node, the node can become a hotspot. For example, if a single node contains too many shards for an index with a high indexing volume, the node is likely to have issues.
To prevent hotspots, use the index.routing.allocation.total_shards_per_node index setting to limit the number of shards on a single node explicitly. You can configure index.routing.allocation.total_shards_per_node using the update index settings API.
When to scale your Elasticsearch cluster
Elasticsearch is built to be always available and to scale according to your needs. Automatic scaling is a perfect approach for a fast-phase deployment and environment. Although it is a capability of Elasticsearch, there are a number of performance considerations and trade-offs, especially given the size of the data that you’ll designate to your shards. You need to determine the number of indices you can store on your shards.
The more shards, the more overhead there is simply in maintaining those indices. The larger the shard size, the longer it takes to move shards around when Elasticsearch needs to rebalance a cluster.
Querying many small shards speeds up the processing per shard, but more queries mean more overhead, so querying a smaller number of larger shards might be faster. In short, it depends.
Use cases when scaling Elasticsearch
If you are skeptical about your environment and cannot decide how many nodes you need for your Elasticsearch, or if you need to scale out if you do need more, here are the following you need to consider:
- Determine the size of your data. Consider if your data is just fewer than 10GiB to start and you have no idea when to add more because your data size is stable. Then, you need to determine how aggressive the traffic towards your Elasticsearch cluster is. Also how greedy do you access or pull data from your cluster.
- Regardless of your data size, if search and queries take a bit of time to respond, consider scaling out. Aim to keep the average shard size between a few GB and a few tens of GB. For use cases with time-based data, it is common to see shards in the 20GB to 40GB range.
- The type of data you’re collecting and storing is essential for your search and retrieval performance. Remember, there are types of node roles are vital to your cluster setup. Every node role in Elasticsearch has its own pros and cons. For example, if your data is used more on machine learning, it makes sense that your node will take the role of ml, which is optimized for machine learning workloads. There’s no sense if you use the node role as data, but the other way around also does not apply since it shall take much more resources while not serving its purpose. For example, setting the node role to your dedicated machine learning, node.roles: [ ml, remote_cluster_client]
- If you have a very small number of nodes but a very large number of shards, Elasticsearch recommends avoiding the gazillion-shards problem. The number of shards a node can hold is proportional to the available heap space; generally, the number of shards per GB of heap space should be less than 20. In that case, if your data goes to that size, consider expanding by scaling out.
The best way to determine the optimal configuration for your use case is through testing your own data and queries. Consider the following use cases when determining whether or not to scale your cluster:
- Using Elasticsearch as your time-series database. Storing logs, audit tracks, timestamps, and other monitoring areas can be very demanding. Of course, part of scaling your cluster is to have the ability to be resilient when it comes to disaster. Availability is part of the reason to scale
- E-commerce, data streaming, businesses that rely on machine learning are very much prone to scale. As said earlier, consider first the prerequisites whether you need to scale or not yet. Cost is also a fundamental part of your decision to scale and the ability to manage the expense when it comes to resource consumption.
- Universities, large organizations, and business organizations that are into knowledge sharing, such as using Elasticsearch as part of your search engine mechanism. For example, using Teams-like solutions (see sample list here), if your data is small and does not constantly change much over time, you might ignore scaling. But for highly accessed, modified, and unpredictably growing data, consider your environment to scale anytime soon. Those kinds of businesses or organizations where the data is used in such a way that it has the ability to learn (machine learning), be logged, and be corrected often, scaling will be a part of your DevOps team’s routine.
- Fundamentally, environments that require your cluster to be highly available, resilient, and resource-intensive will imply scaling as part of your routine.
How to scale Elasticsearch feasibly
Elasticsearch features a very strategic and optimistic approach when managing humongous amounts of data especially when speaking of data retrieval at blazing speed. For that reason, Severalnines built a feature in ClusterControl to deal with these concerns and problems that organizations are concerned of. It can be expensive and also difficult to find experts to manage very large data that requires full attention to detail.
Since ClusterControl version 1.9.3, we support the deployment of Elasticsearch.
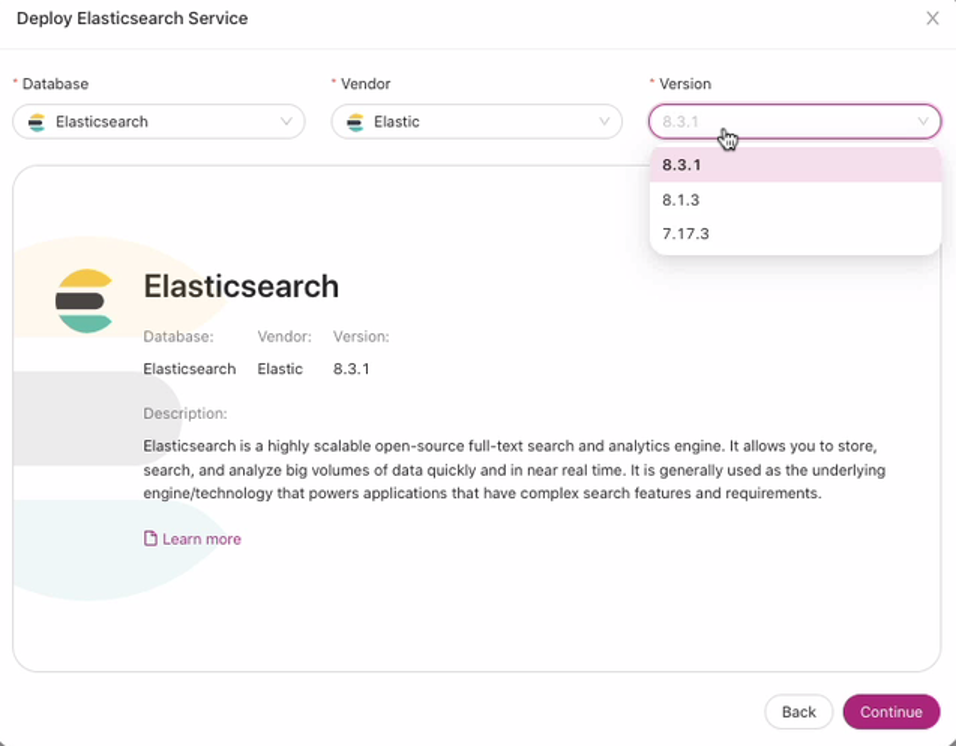
Previous versions are not supported and currently, as of this writing, only version 8.3 is yet supported and we’re working on supporting newer versions of Elasticsearch.
Setting up your deployment is quite easy and straightforward. You just move through this sequence of steps:
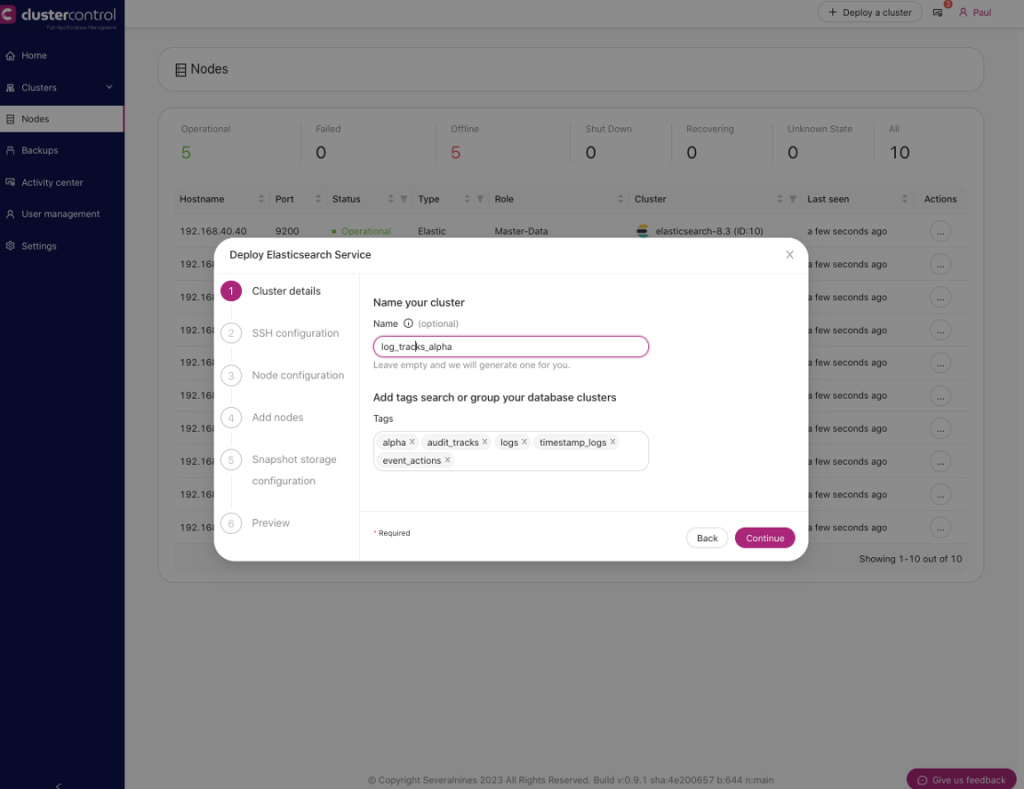
- Cluster details. Specifies the details of your cluster, such as name, tags
- SSH configuration. This is where you set up the SSH configuration required that your ClusterControl controller node can use to login or enter to your designated nodes assigned for Elasticsearch provision.
- Node configuration. This is where you specify the port to use for Elasticsearch for node communication (default is 9200). Specify your desired admin user and admin password. You can also choose whether to rely on your OS repository or not when installing Elasticsearch and its required packages. For example, if you do rely on your internal repo since the internet is not available for your DB nodes.
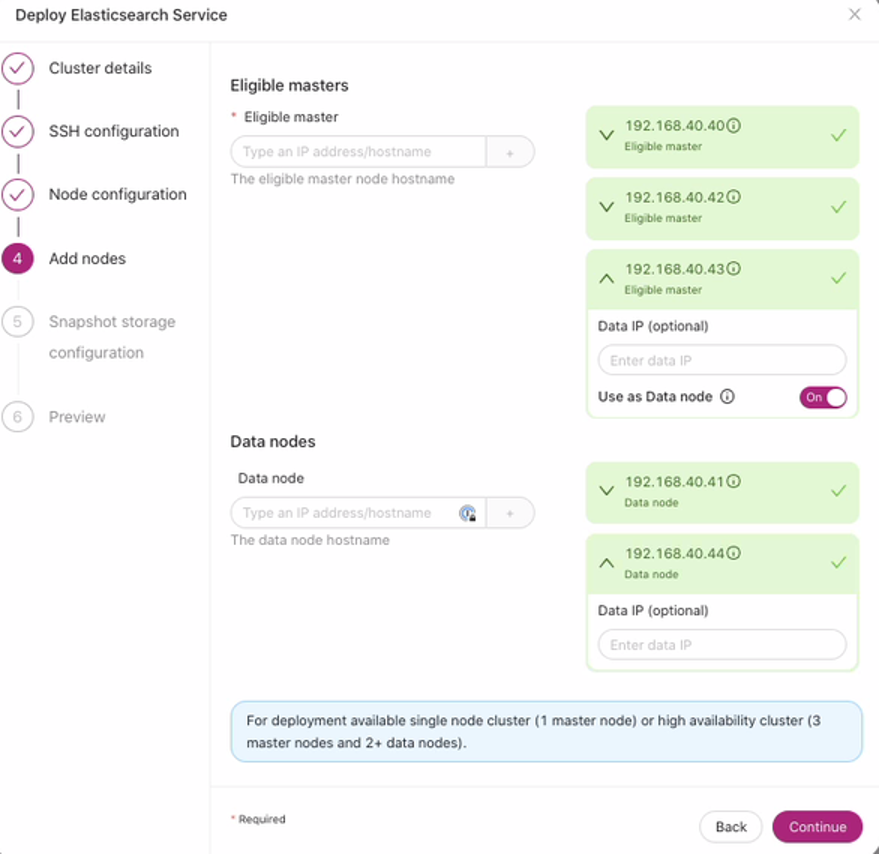
- Add nodes. This is the step where you have to setup your server based on your desired assignments. For example, what node has to take the role of a master and data or role of a data-only node. ClusterControl only supports the node role of master and data eligible or data roles during new deployment. The coordinator (Coordinating Node) node can be added as a new node once an Elasticsearch cluster is already created and registered in ClusterControl.
- Snapshot storage configuration. ClusterControl can automatically set up NFS for you, the purpose of which is very important for backing up your data. Elasticsearch uses a snapshot for your backup for data recovery purposes.
- Preview. Before ClusterControl sets up and deploys your cluster, a preview of your desired action shall be shown just to have a summary view and avoid mistakes or typo errors if there are such.
For example, a screenshot below is how you setup your Cluster details in ClusterControl view.
ClusterControl recommends also to have a setup of 3 master nodes (highly required for high availability and cluster resilience). See below a good example under the Add nodes step:
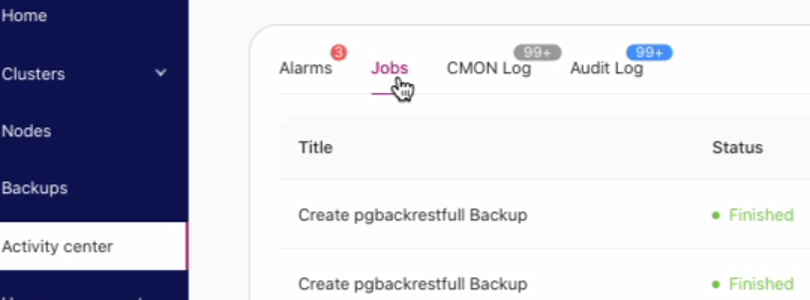
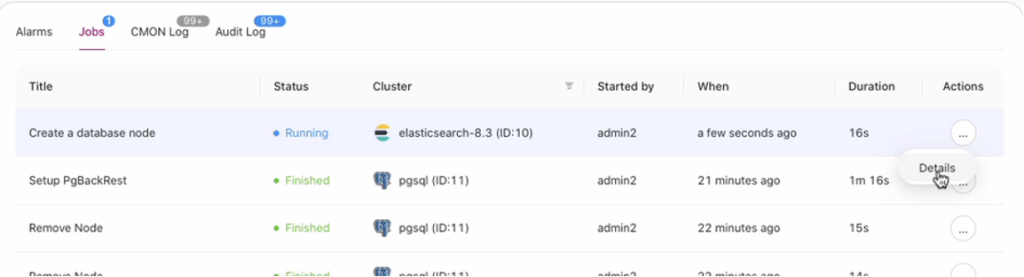
Once you hit Finish under the Preview step, you might want to verify using the job activity log. Just go to:
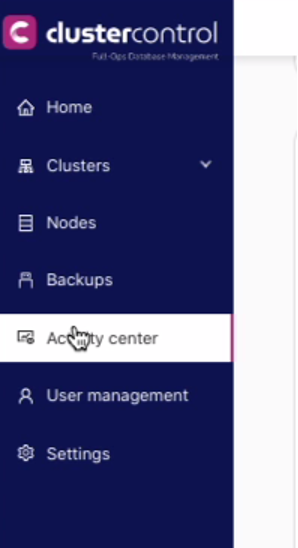
Then hit the Jobs tab and locate the job for creating your Elasticsearch cluster and click details just like below:
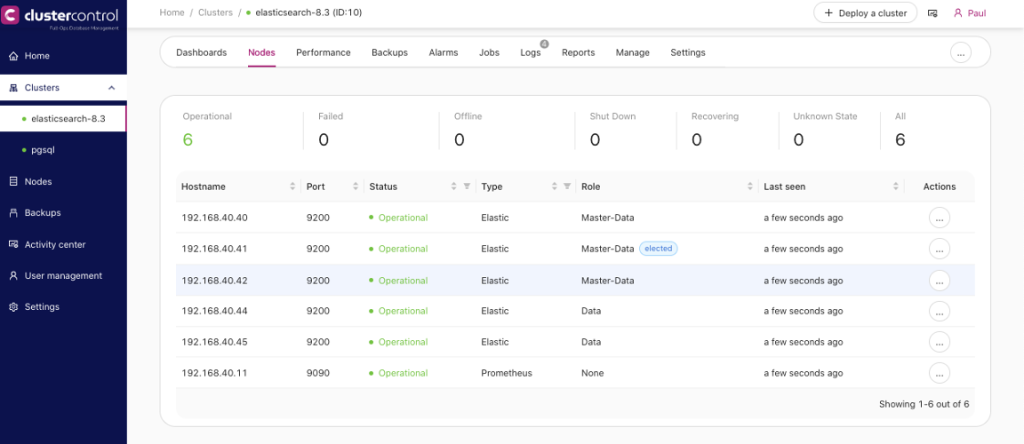
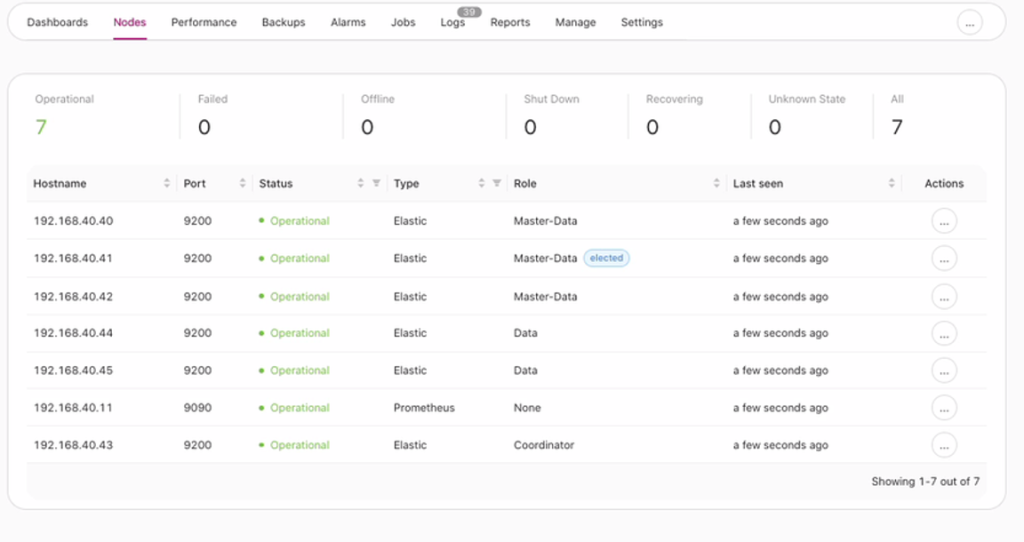
In this blog post, the cluster I created for this topic has the following view:

Currently, the master is on 192.168.40.41.
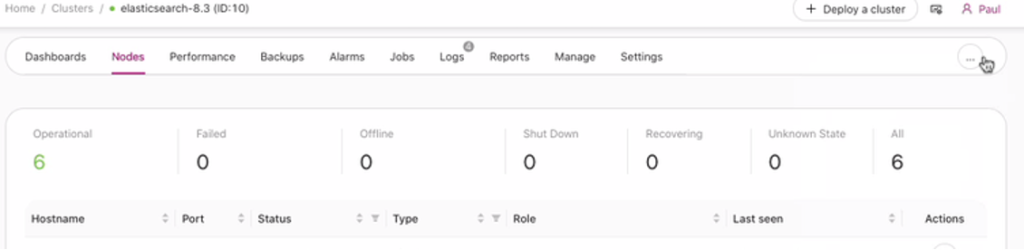
Adding a new node to existing Elasticsearch cluster
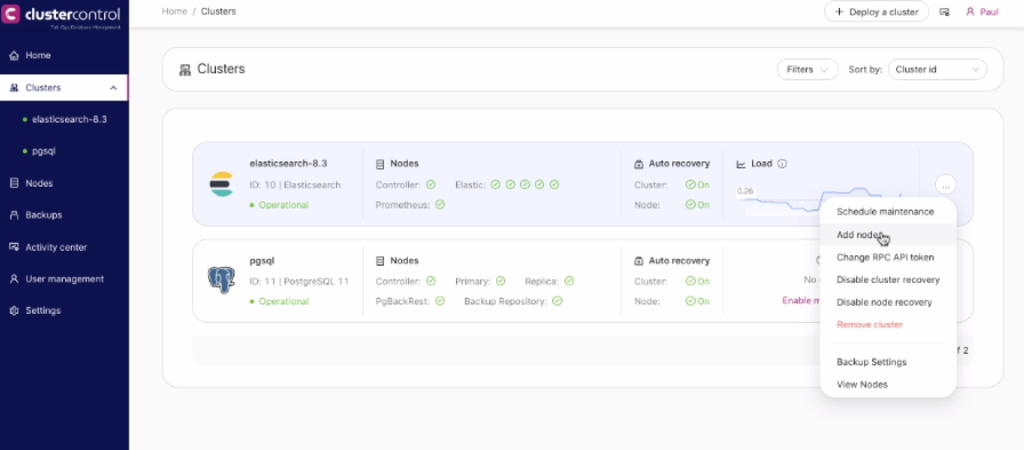
Now, consider that I wanted to scale out. This can be easily done with ClusterControl. All you have to do is click the ellipsis button as shown below:
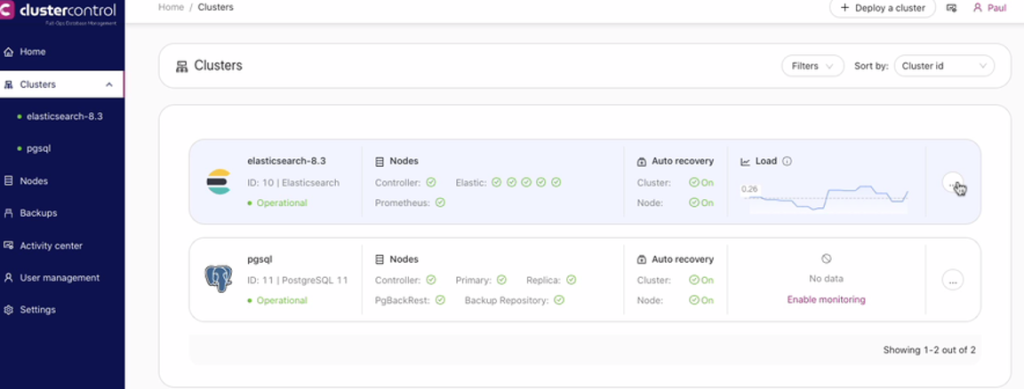
You can also get this in the list of clusters as shown below:
After adding a node, a new panel will appear allowing you to specify the IP address and choose the node role. During this operation, ClusterControl allows you to specify different roles other than master-data but you can assign it as a master, data, or coordinator. See below:
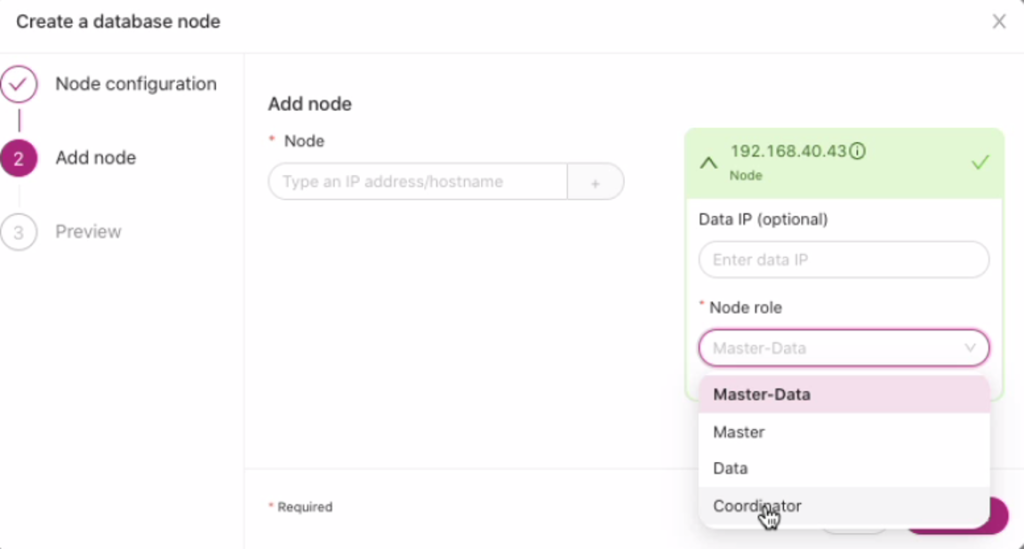
For this exercise, I’ll choose the role of a coordinator (coordinating node in Elasticsearch).
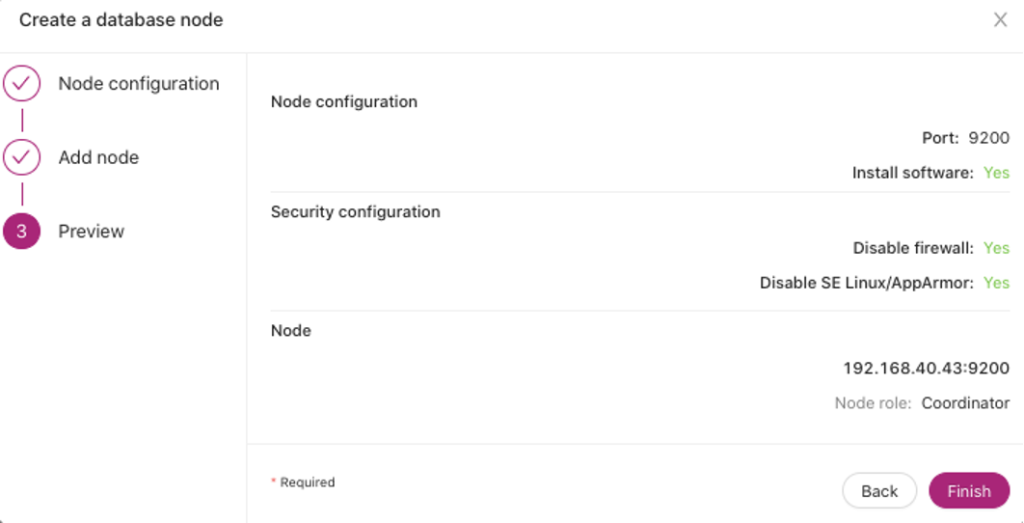
Once set, click the Finish button and follow the job activity log to monitor the actions and tracks that ClusterControl is doing.
After it has been done, my node and my data tiers are displayed in the cluster. The Nodes tab will show the following list just like below:
Summary
Elasticsearch is a complete stack providing the database and storage capabilities under the ELK stack. It can manage hundreds to thousands of shards, but it requires some knowledge and experience to manage it at this scale. Tools such as ClusterControl shorten the learning curve by making setup, configuration, and management efficient and reliable. But don’t take my word for it; test ClusterControl free for 30 days.