blog
PostgreSQL Tuning: Key Things to Drive Performance

PostgreSQL and Performance
Performance is one of the key requirements in software architecture design, and has been the focus of PostgreSQL developers since its beginnings, also shown in the following PostgreSQL Git sources commit:
commit d31084e9d1118b25fd16580d9d8c2924b5740dff
Author: Marc G. Fournier
Date:   Tue Jul 9 06:22:35 1996 +0000

   Postgres95 1.01 Distribution - Virgin Sources

[...]

diff --git a/src/backend/access/heap/stats.c b/src/backend/access/heap/stats.c
new file mode 100644
index 0000000000..d41d01ac1b
--- /dev/null
+++ b/src/backend/access/heap/stats.c
@@ -0,0 +1,329 @@
+/*-------------------------------------------------------------------------
+ *
+ * stats.c--
+ *    heap access method debugging statistic collection routines
+ *
+ * Copyright (c) 1994, Regents of the University of California

[...]

+ * Also note that this routine probably shouldn't have to exist, and does
+ * screw up the call graph rather badly, but we are wasting so much time and
+ * system resources being massively general that we are losing badly in our
+ * performance benchmarks.
+ */
PostgreSQL achieves performance by implementing various features:
- Several index types
- Query planner and optimizer that can take advantage of multiprocessors systems
- MVCC
- Table partitioning
Environment Selection
With the many options available today come as many questions:
- On premise, or in the cloud?
- Bare metal or virtualized?
- Hardware branded or build your own?
- How do the PostgreSQL low level functions or fsync affect the hardware performance?
- Local disk or shared storage?
- What operating system tunables need to be set?
Again, the PostgreSQL wiki is a very good starting point for all things performance.
What Are the Key Things to Look For?
Since there is plenty of literature out there touching various aspects of PostgreSQL performance tuning and system design (hint: search the page for xfs), this blog isn’t meant to be a deep dive into any of those already discussed topics, but rather a sysadmin’s perspective on where to start when the main focus is avoiding resource contention. I will also point out many references that address specific issues in more detail. Expert advice in all areas critical to PostgreSQL performance is available through the many companies offering Professional Services.
Let’s start!
Information Gathering
Assuming a default installation, and knowing that PostgreSQL doesn’t try to be well tuned out of the box and there may even be some quirks, this step involves setting up the necessary monitoring tools.
Good monitoring is critical in understanding application and be able to quickly track down the affected resources, and this is particularly true for cloud providers where access to the database host may not be available in order to run benchmarks for CPU or I/O:
Reacting to system performance alerts
Monitoring tools will graph and alert on system performance indicators:
CPU:
- Alert — High usage indicates a long running query.
- Impact — Application response time.
- Action — Review database statistics metrics metrics to identify queries that need tuning.
I/O:
- Alert — High number or reads.
- Impact — Application response time.
- Action — Add another read replica. Review database statistics metrics to identify long running queries.
- Alert — High number of writes.
- Impact — Application response time.
- Action — Tune GUC parameters shared_buffers, work_mem and maintenance_work_mem. Tune the checkpointer and make sure autovacuum is tuned correctly. If PostgreSQL is installed on own hardware configure tablespaces and/or consider sharding but understand the sharding caveats.
Memory:
- Alert — High memory usage.
- Impact — I/O performance.
- Action — Review database statistics metrics metrics to identify queries that need tuning.
Network:
- Alert — High Latency. Usually this is a DBaaS issue.
- Impact — Clients, replication.
- Action — Relocate database hosts closer to frontend servers.
- Alert — High number of connections.
- Impact — Clients.
- Action — Consider using connection polling.
Database internal performance indicators
The pg_* views are the window to database engine performance, and PostgreSQL management applications have been written to aid in correlating the wealth of information otherwise available through various SQL queries. Additional extensions exist and they are often integrated or available as plugins.
Using such tools simplifies the DBA task and ensures that best practices are followed when setting up and configuring the database cluster.
Database Statistics
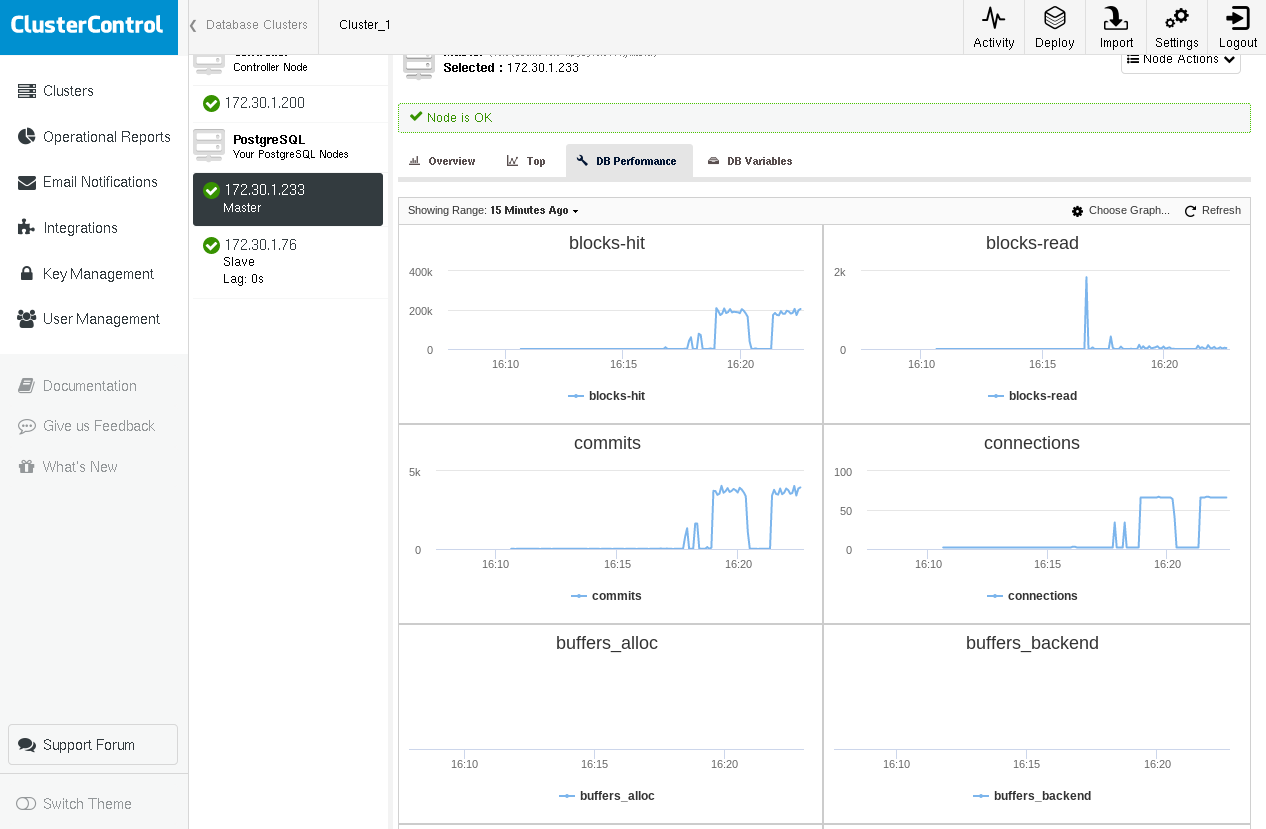
Monitoring tools such as ClusterControl use database activity statistics to aid the DBA with performance tuning:
Query Tuning
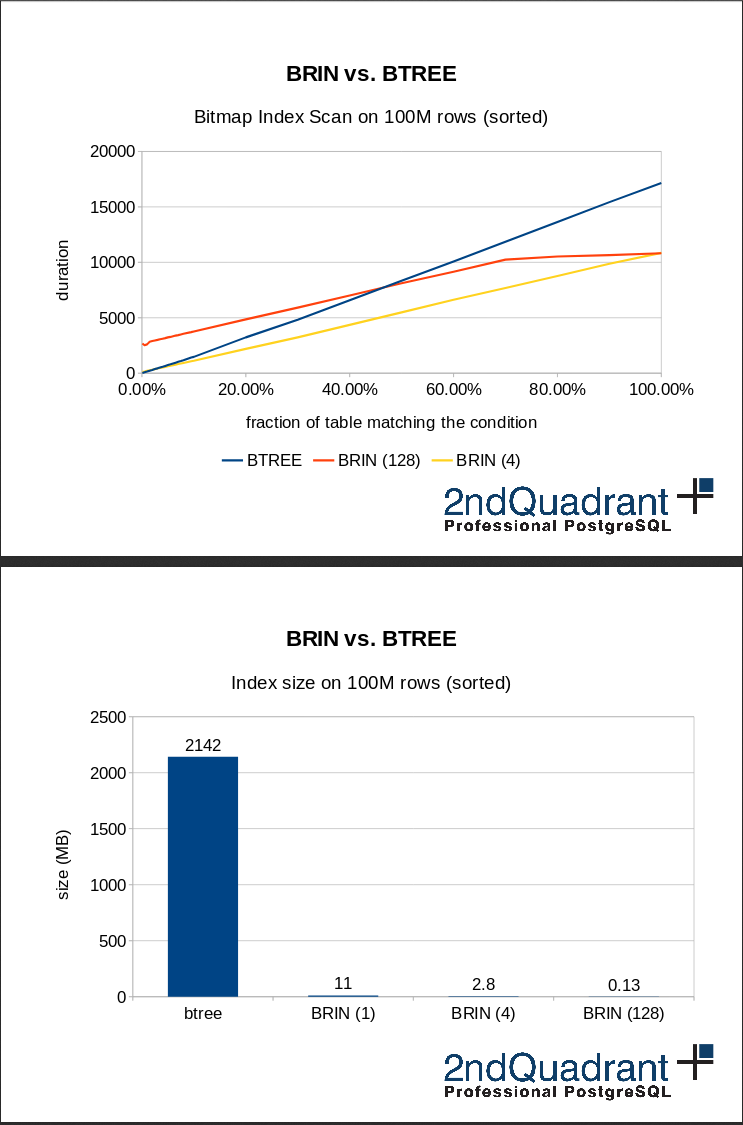
Starting with version 9.5 PostgreSQL includes considerable query performance improvements such as BRIN indexes and parallel queries:
Locking
Concurrency Control is dedicated a whole chapter in PostgreSQL documentation. Use monitoring tools to be alerted when the number of locks or lock duration exceed the threshold and resolve the issue by looking for missing indexes, reviewing the application code, or by switching to connection polling.
Bulk Load
synchronous_commit can be turned off during large data imports. More options are discussed in the PostgreSQL documentation section Populating a Database.
Conclusion
PostgreSQL performance tuning is a complex task. The complexity comes from the many tunables made available, which is a strong argument in favor of PostgreSQL. There is no silver bullet to solving performance issues, rather it is the application specifics that ultimately dictate the tuning requirements. Therefore monitoring tools can assist in gaining performance insights relative to the system performance and further allow to identify the PostgreSQL specific areas that need tuning as well as the SQL queries that require optimization. Additionally database management systems can assist with the setup and administration of PostgreSQL in order to ensure that best practices are followed.