blog
How to Automate Database Workload Analysis With ClusterControl Performance Advisors

ClusterControl Community Edition gives us the opportunity to install database clusters and get a real-time representation of database status and queries for free. A big chunk of ops management consists of tracking your monitoring systems. Hundreds of raw metrics can be interpreted and consolidated in various ways to give you deep insights into your database operations and whereby to optimize them.
Metrics data is not enough on its own. To have a better view of the cluster usage, you have to have some alerting too. The simplest form is to establish thresholds on major metrics. If the threshold is reached, the user has to be alerted. But with hundreds of metrics and sophisticated relations between them, it’s not an easy task to choose the most relevant ones and avoid false alerts. Many times it requires deep workload analysis. A good example here is storage capacity monitoring. You may have your thresholds set solid to 80 % and storage usage at the level of 20% which could mean a stable state. Still, if at some point data start growing rapidly, you will see alerts coming starting at threshold level 80-100%. Depending on the growth speed, you may not have enough time to act. If you enable some sort of prediction, you can have alerts rising from the 20 to 100% range.
To automate the analysis of the database workload, you can enable ClusterControl advisors. Advisors are mini-programs that are executed by ClusterControl, either on-demand or after a schedule. They can be anything from simple configuration guidance, warning on thresholds or more complicated rules for forecasts or cluster-wide self-regulation tasks based on the status of your environment. In general, advisors perform more detailed analysis and produce more comprehensive recommendations than alerts.
Advisors Architecture
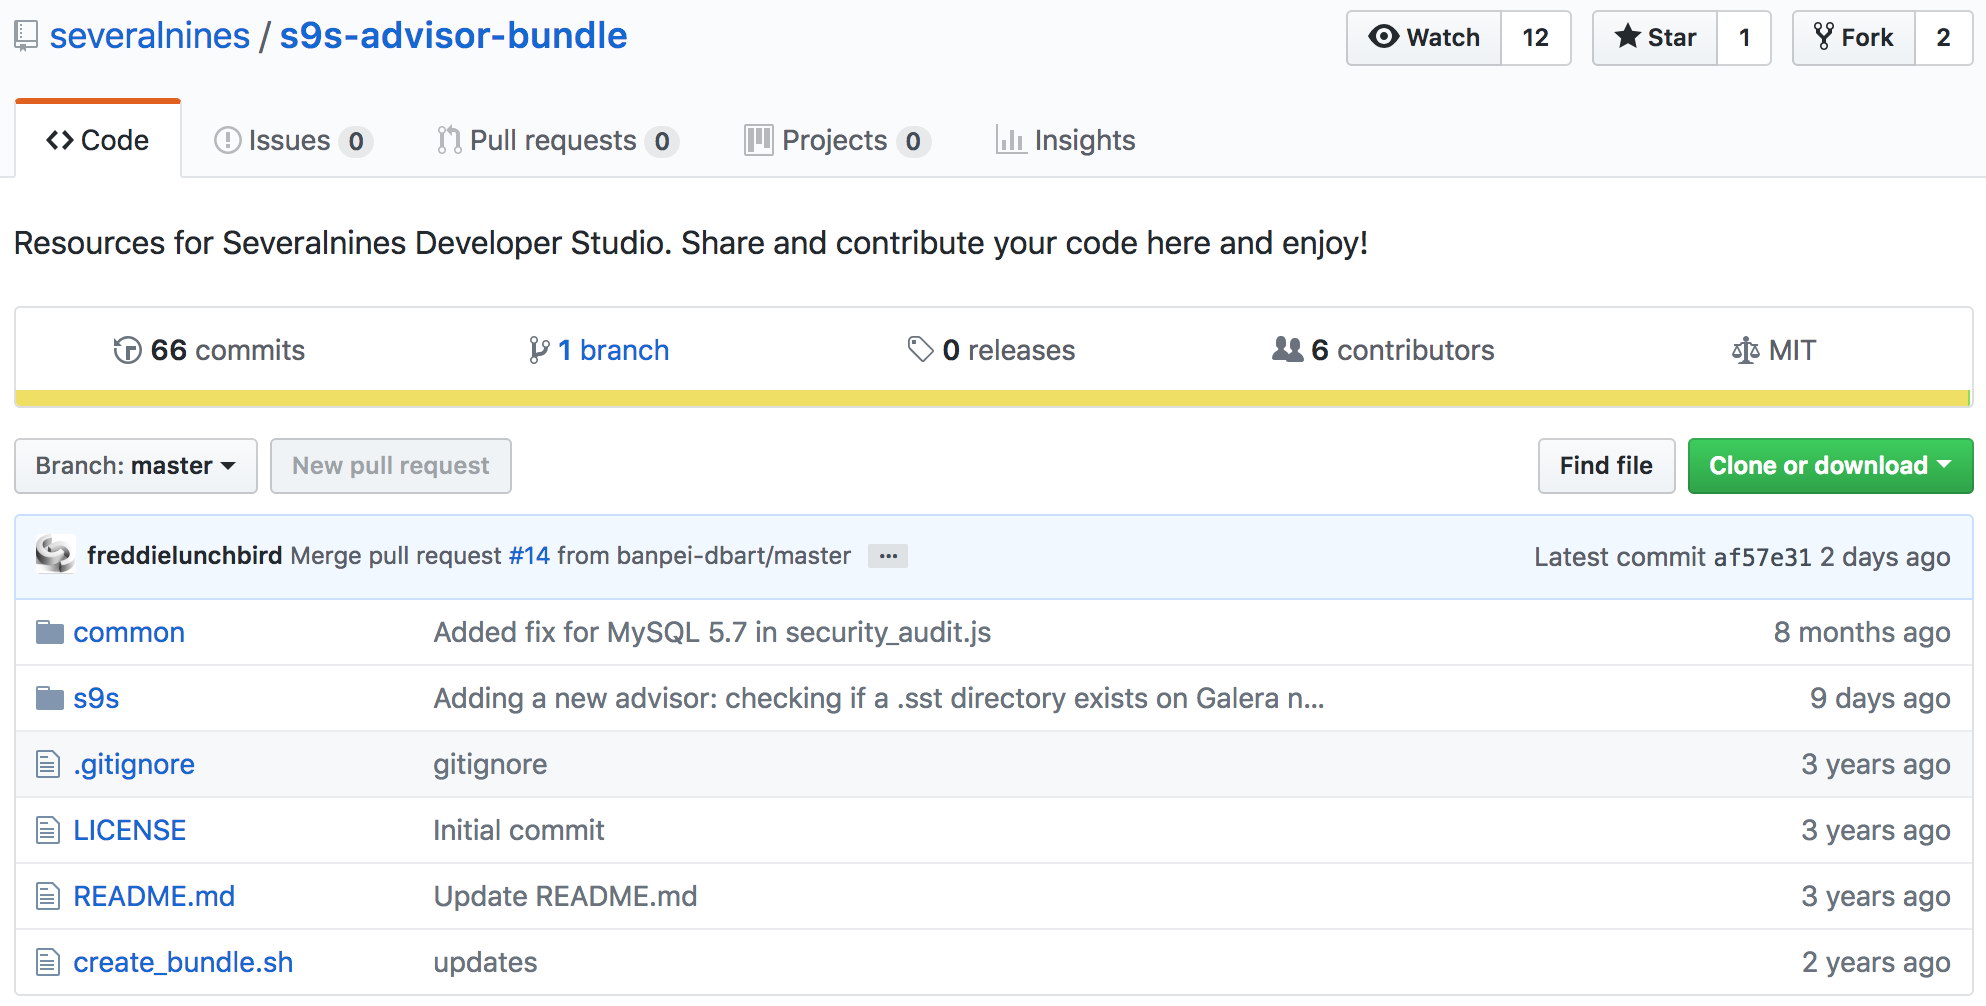
The advisor’s programs are stored inside the ClusterControl internal cmon database. You can add new or alter/modify existing advisors from the dedicated user interface. We also have an advisor Github repository where you can share your advisors with other ClusterControl users.
The language used for the advisors is the so-called ClusterControl DSL. The ClusterControl DSL enables you to execute SQL statements, run shell commands/programs over all your cluster hosts, and retrieve results for advisors/alerts.
ClusterControl DSL semantics is similar to Javascript with a couple of differences. Below you can find the most significant differences:
- Semicolons are mandatory like in C or C++.
- Not all numbers are handled as double precision floating point values, there aree integers and even unsigned long long integers. Those are needed to handle disk sizes and network traffic measured in bytes.
- There are associative arrays with the data type Map.
- The arrays are two dimensional, but they can be used as one-dimensional arrays (e.g. a[10, 11] and a[10] are also valid).
- There is a List type.
- JavaScript uses a period in function names like JSON.parse(text), here we use the C++ notation like JSON::parse(text).
- New variables created on-the-fly in functions are local variables and not globals.
- The language implements a C like the #include preprocessor directive.
ClusterControl advisors are present for MySQL or MariaDB-based clusters like Galera, Replication, NDB Cluster, MongoDB and PostgreSQL. With the access to developer studio feature, you can also extend the advisors with your programs.
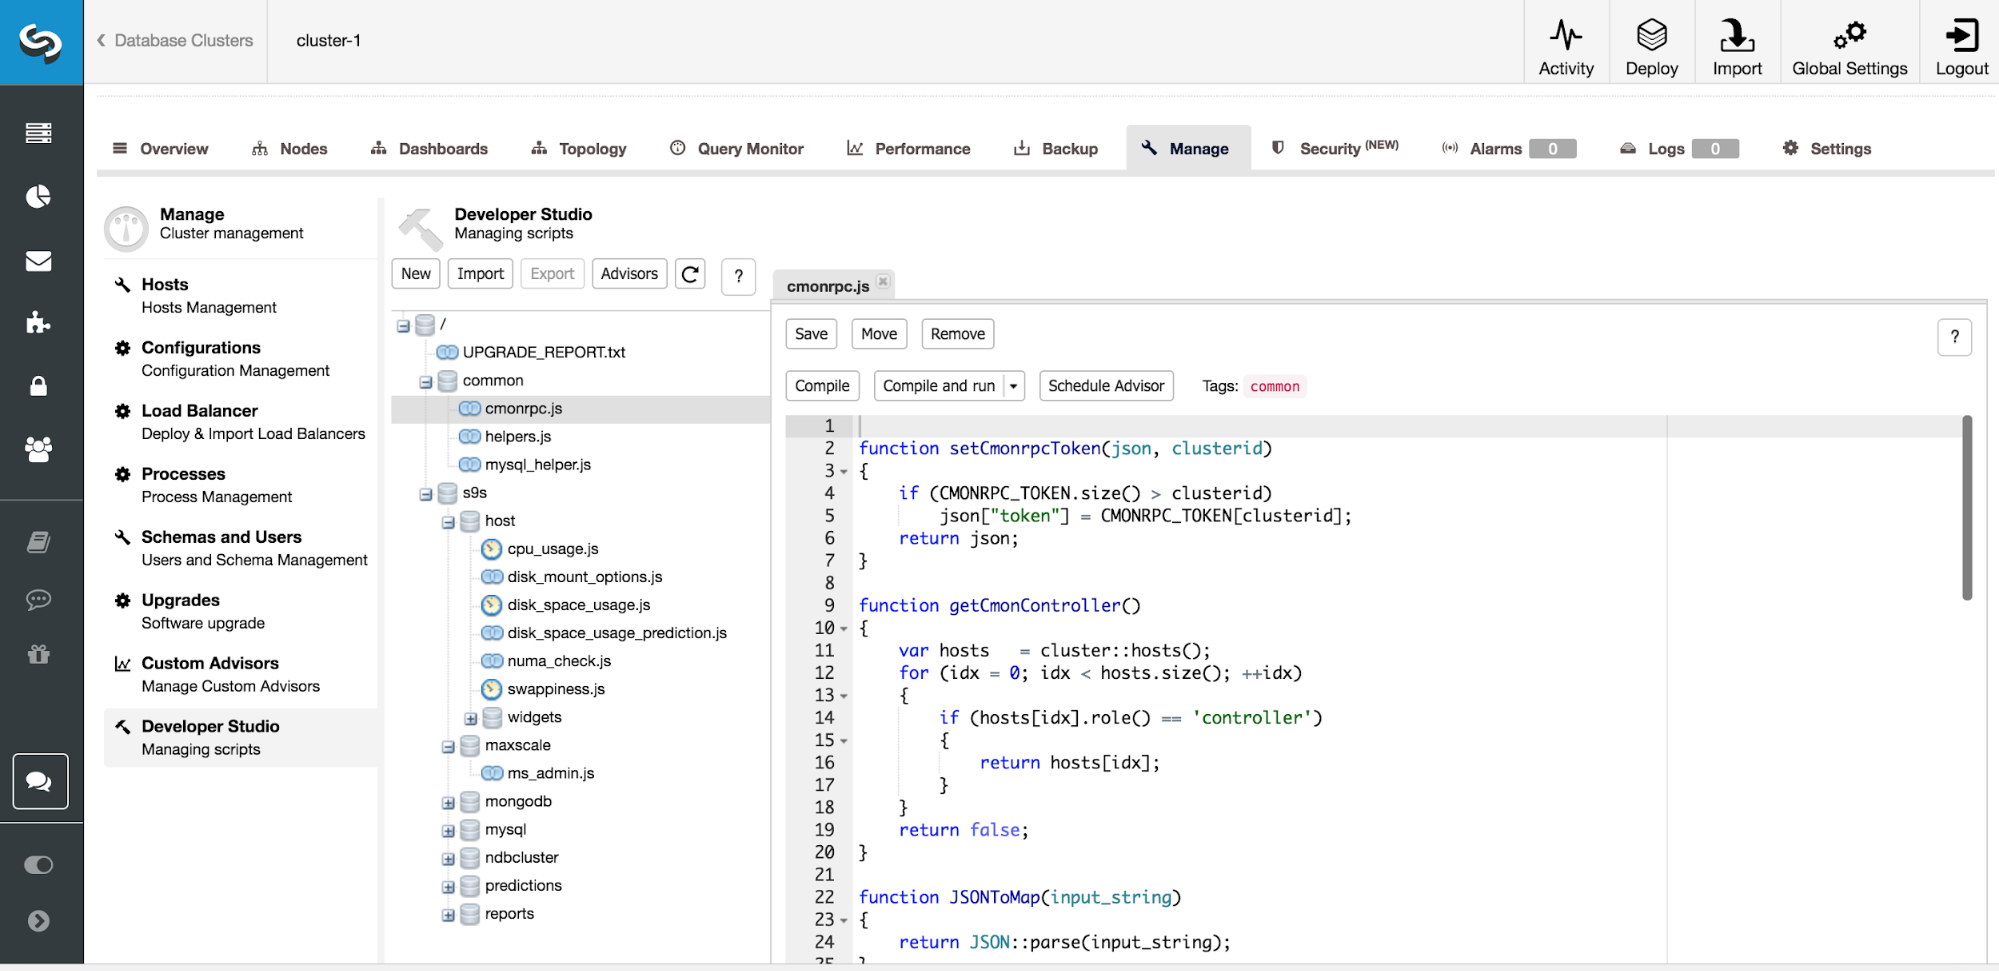
The Developer Studio interface can be found under Cluster > Manage > Developer Studio. This will open an interface like this:
There are some limitations. The Advisors can make use of SSH and database client libraries that come with CMON with the following restrictions:
- 5 seconds of a hard limit for SSH execution,
- 10 seconds of default limit for database connection, configurable via net_read_timeout, net_write_timeout, connect_timeout in CMON configuration file
- 60 seconds of total script execution time limit before CMON ungracefully aborts it.
For short-interval monitoring data like MySQL queries and status, data are stored directly into CMON database. While for long-interval monitoring data like weekly/monthly/yearly data points last every 60 seconds and stored in memory for 10 minutes. These actions are not configurable due to the architecture design.
Predefined Advisors
ClusterControl comes with a list of pre-defined advisors that are intended to track the state of different metrics and state of your databases. When needed, an alert is created.
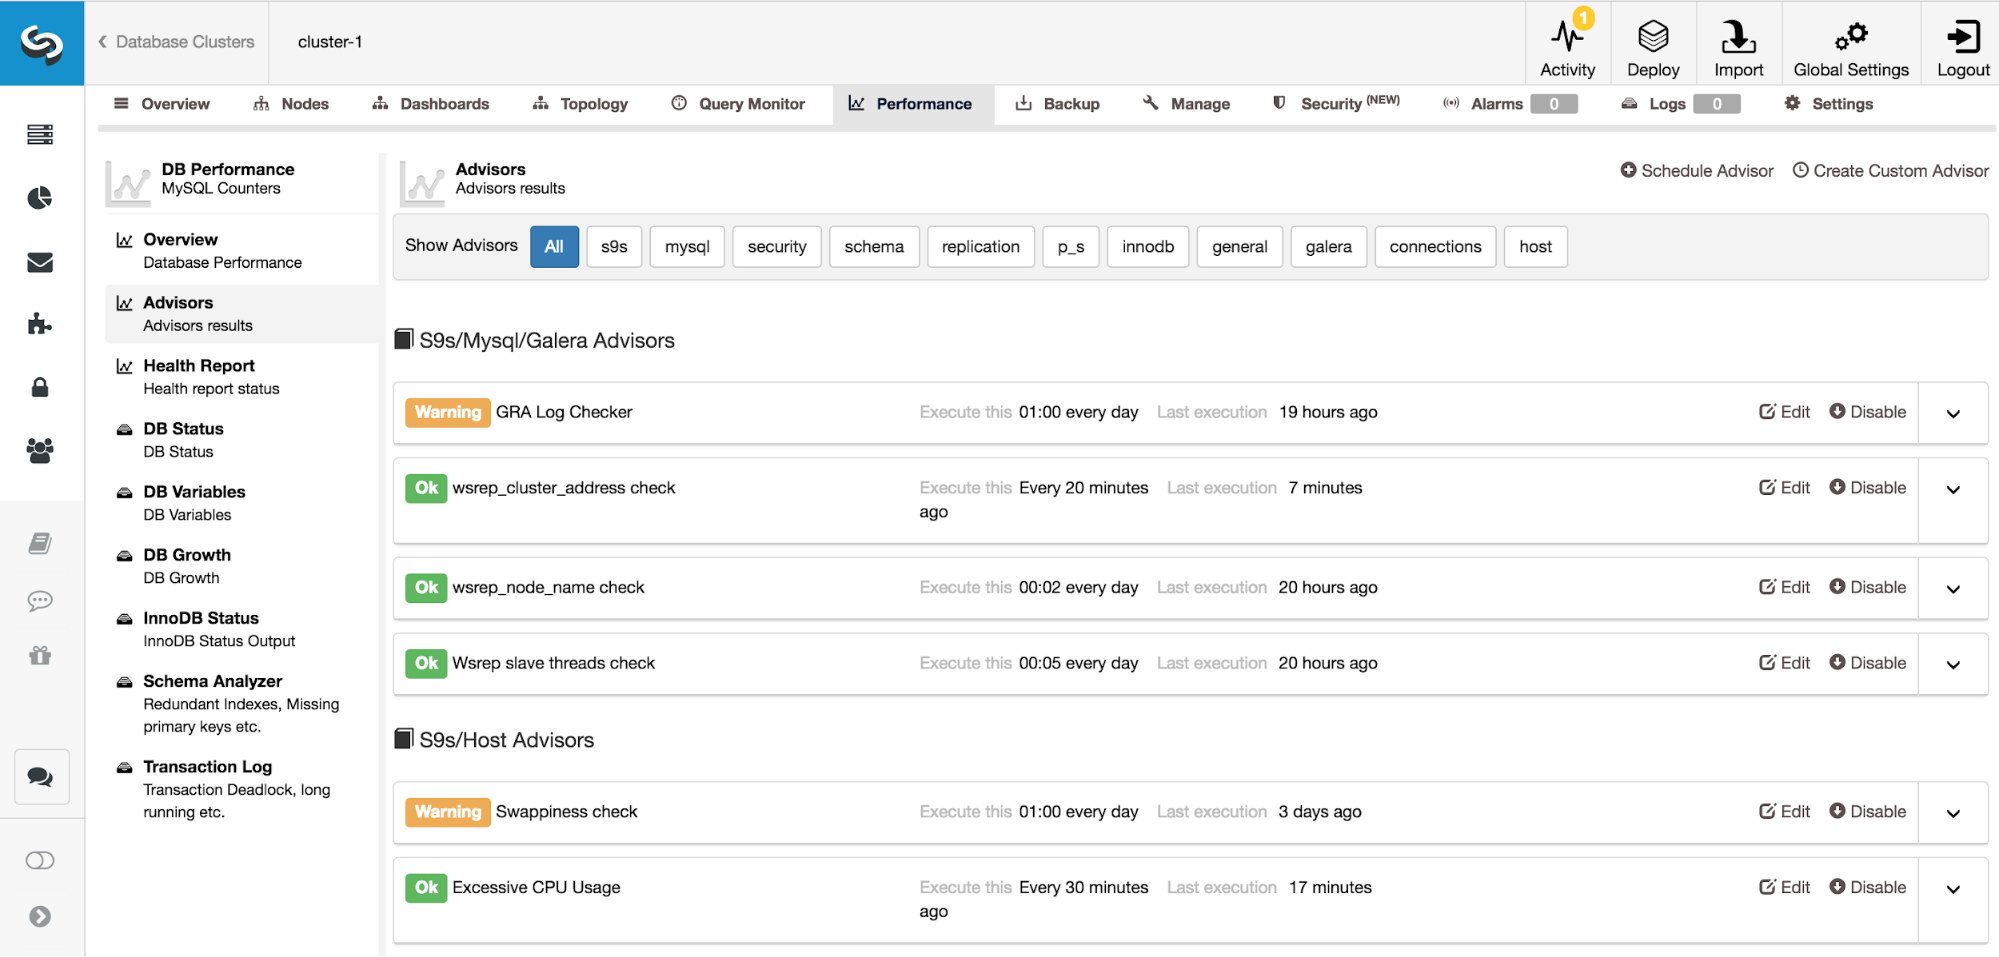
Built-in advisors are divided into multiple segments – mysql, security, schema, replication, performance schema, InnoDB, Galera, connections, and hosts. With the different types of advisors, you can see security checks, resource usage thresholds into more sophisticated ones such as an advisor that determines the write load on a Galera cluster and rates if the Galera cache file is adequate in size to support a replication window threshold.
You can also see the catalog of the advisor with the date/time since the last update. Some advisors are scheduled to run only once a day so their advice may no longer reflect the reality, for instance, if you already resolved the issue you were warned about. Advisors can be managed from the GUI interface, where you can enable, disable, and modify execution times. You can also manually re-run the advisor.
To see last check state, simply expand the advisor name:
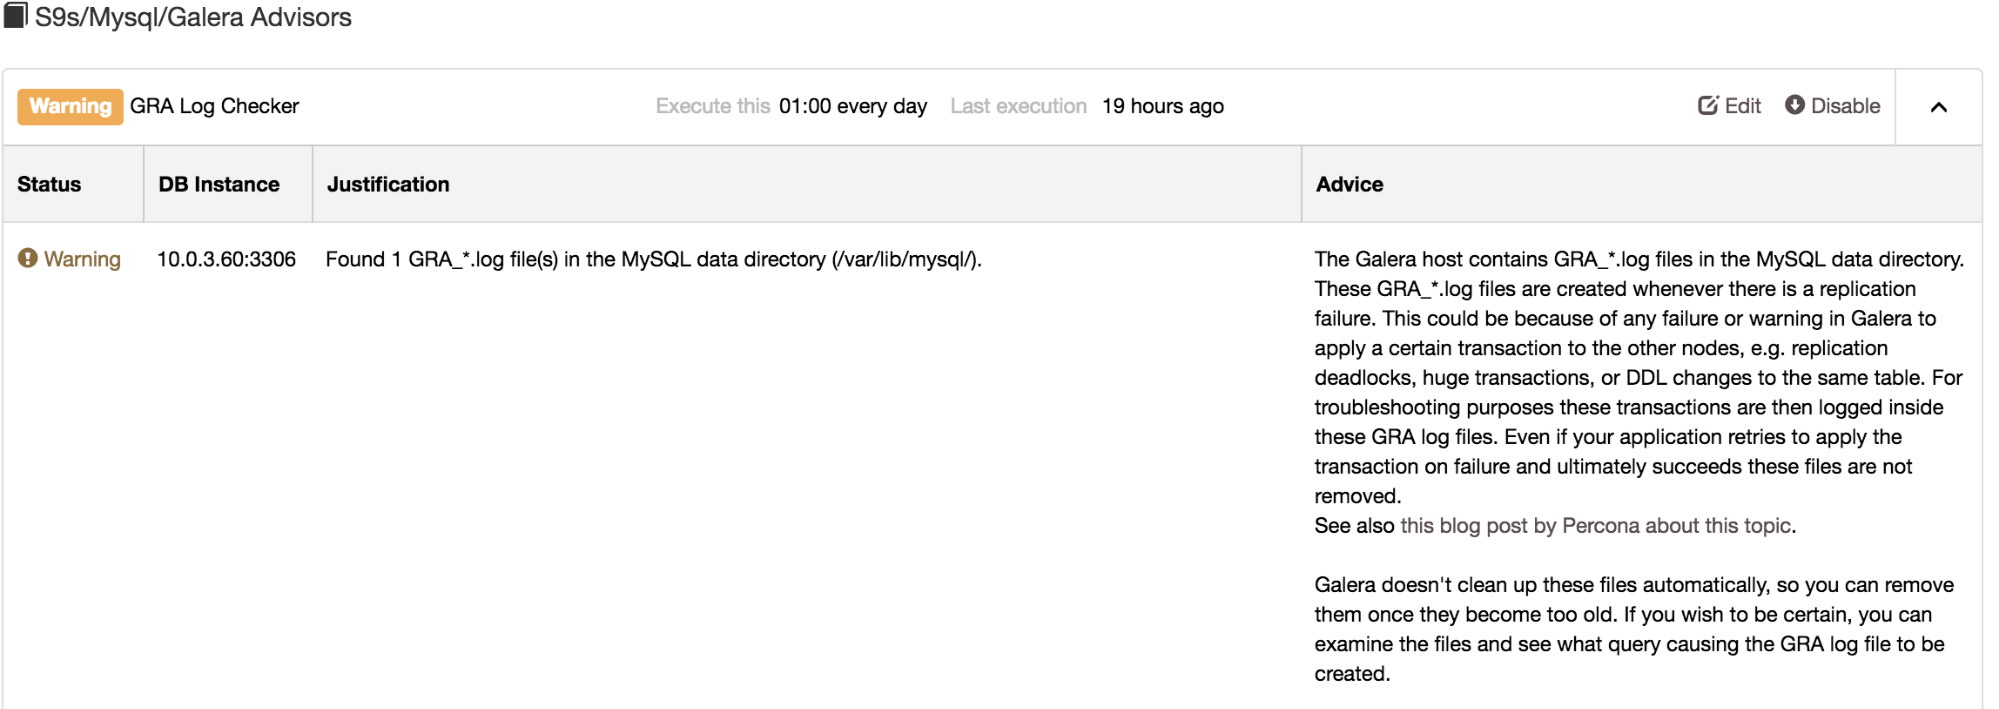
Some of the advisors are armed with advice which should help you to resolve the issue.
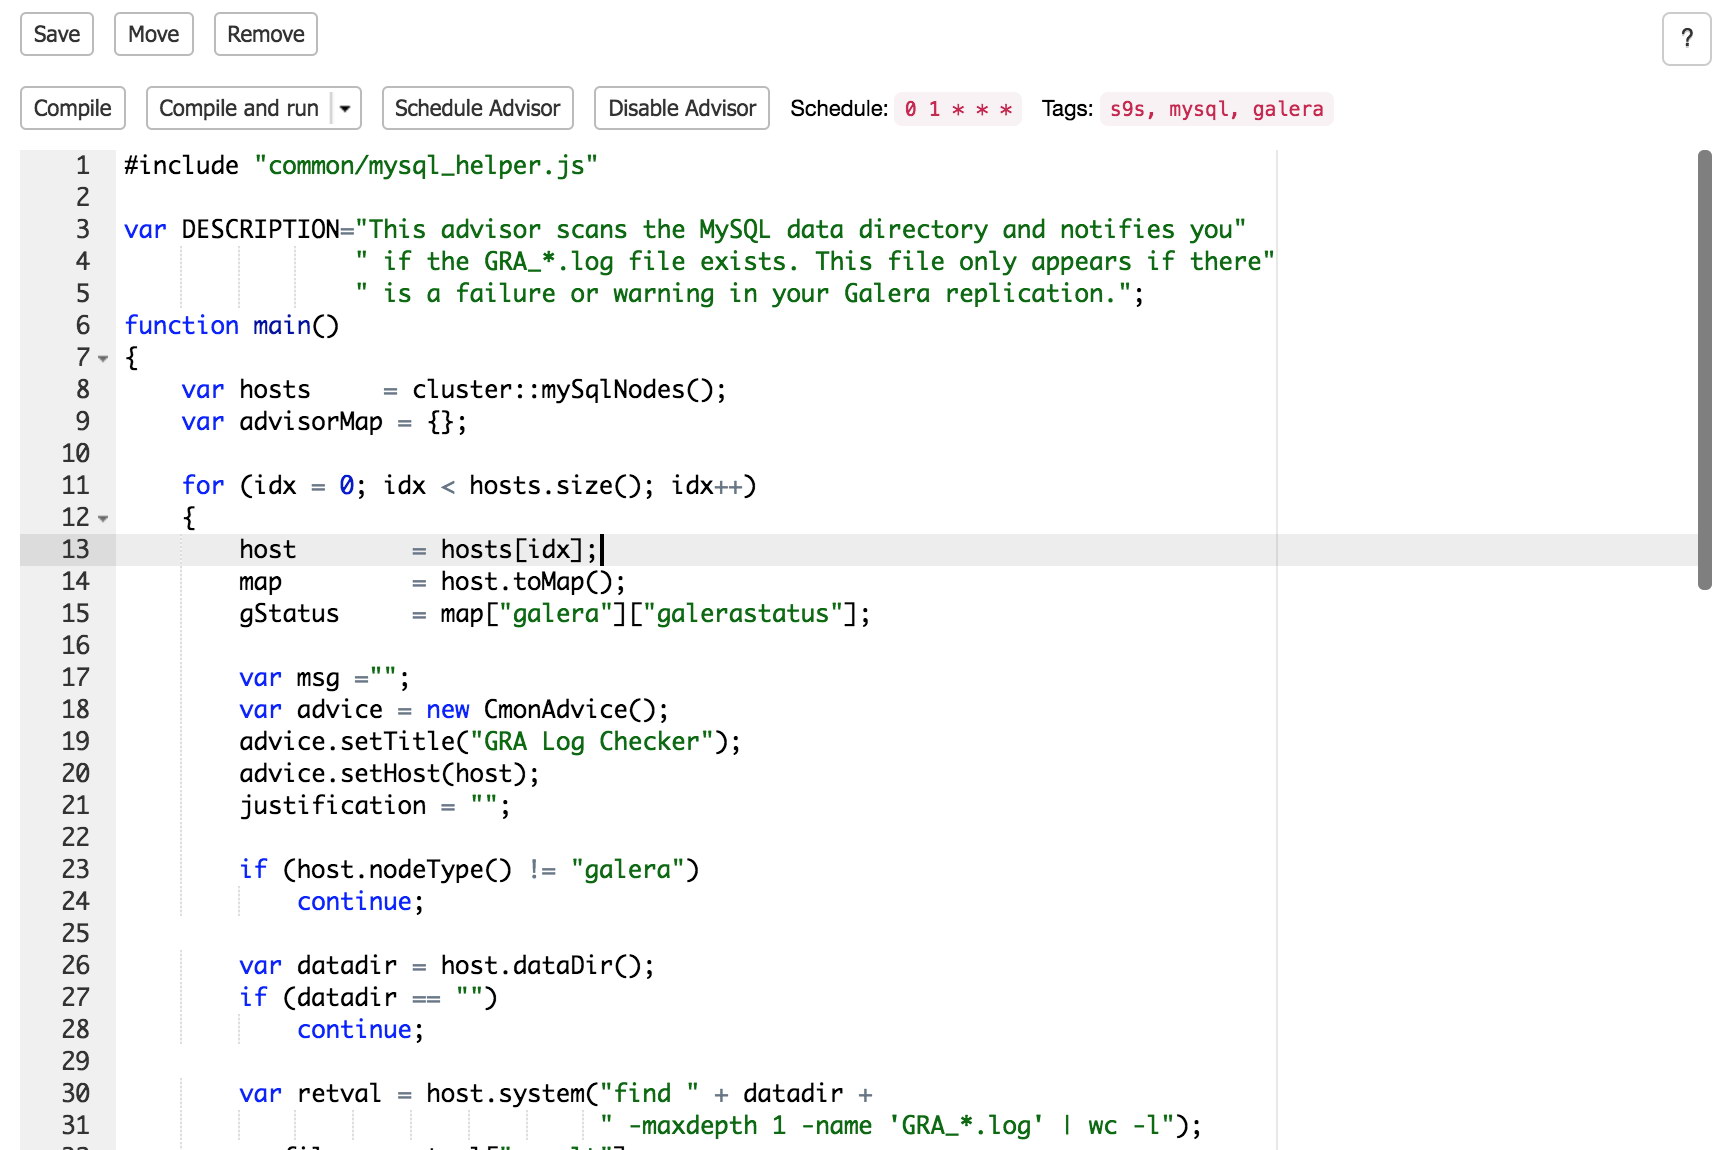
The edit section will point you to the ClusterControl developer studio where you can see the code used for the specific check. In this case, we are looking at GRA Log Checker. You can see the exact code, with the option to modify the source, compile and change the schedule. Tags option can be used to choose where advisor should be executed.
In the below list you can see the actual program names and groups that will monitor your cluster infrastructure.
| Advisor type | Advisor program |
|---|---|
| Galera Advisors | GRA Log Checker Wsrep_address_cluster_check Wsrep_node_name_check Wsrep_slave_threds_check SST Auth advisors WSREP Auth methods |
| Host advisors | swappines check excessive CPU usage checking disk space |
| Percona Schema advisors | table access without index check unussed indexes performance schema top queries |
| Replication Advisors | binlog storage location expire binlogs |
| Schema advisors | checking for MyISAM tables tables without primary key tables with duplicate indexes |
| Security advisors | access from any host check DB accounts without passwords |
| Connections Advisors | connections currently used connection ever used |
| General advisors | system timezone alignments |
| InnoDB advisors | innodb_log_filesize_check innodb percent dirty pages |
| Nmap advisors | collection lock percentage |
| MongoDB | sharding advisors connections used replication check replication window |
| NDB cluster advisors | data memory usage Index memory usage |
Custom Advisors
ClusterControl offers various type of database system advisors, so you can see if your system is appropriately set. However, each environment may have some unique components which require deep customization. That’s why we provided users the option to develop their scripts to check for essential bits specific to the environment. Such scenarios can also leverage other ClusterControl functionality, for instance, if you’d like to implement automated scaling based on the growth of some metric. So, advisors consolidated with ClusterControl CLI can give you an option to autoscale your environment if your performance is lower than expected – based on system resource usage, query response or other KPI.
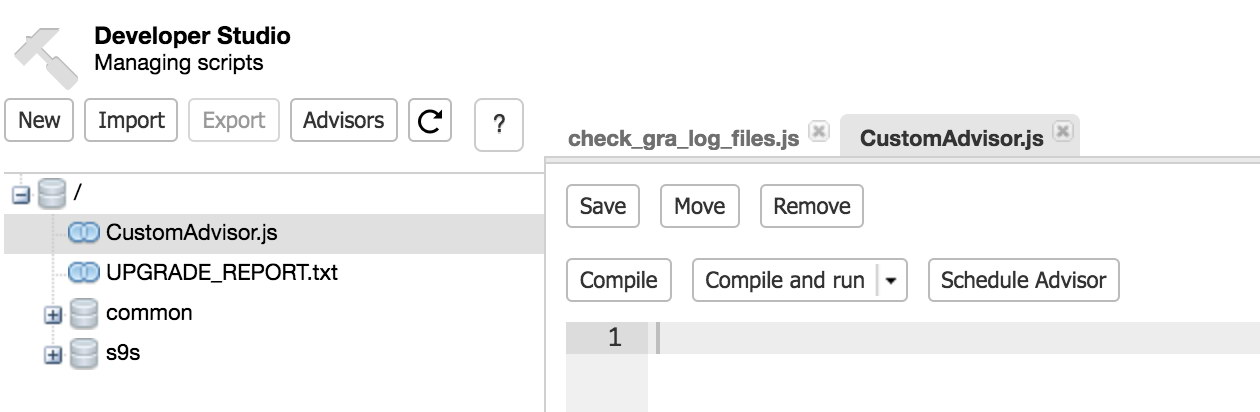
Advisors can be created, compiled, tested and scheduled directly from ClusterControl UI, under Manage -> Developer Studio.
To learn how to build your own advisors you can use code examples from existing programs. For example, to build a script based on CPU performance, you can copy cpu_usage.js and extend it with some response actions.
To see how to write your own custom advisors please check our other blogs:
- https://severalnines.com/blog/clustercontrol-developer-studio-write-your-first-database-advisor
- https://severalnines.com/blog/clustercontrol-developer-studio-automatically-scale-your-clusters
Conclusion
ClusterControl advisor rules are a set of best practices that allow DBAs and sysadmins to manage the dynamic nature of their servers over time. Advisors module monitors all database nodes for adherence to recommended configuration and server settings. It can help save time and work in our daily duties and is a good reason to enhance or even replace your current database monitoring system with ClusterControl.