blog
Effective Monitoring of MySQL With SCUMM Dashboards: Part 3

We discussed in our previous blogs about the MySQL-related dashboards. We highlighted the things that a DBA can benefit from by studying the graphs, especially when performing their daily routines from diagnostics, metric reporting, and capacity planning. In this blog, we will discuss the InnoDB Metrics and the MySQL Performance Schema, which is very important especially on monitoring InnoDB transactions, disk/cpu/memory I/O, optimizing your queries, or performance tuning of the server.
This blog touches upon the deep topic of performance, considering that InnoDB would require extensive coverage if we tackle its internals. The Performance Schema is also extensive as it covers kernel and core parts of MySQL and storage engines.
Let’s begin walking through the graphs.
MySQL InnoDB Metrics
This dashboard is great for any MySQL DBA or ops person, as it offers a very good view into the InnoDB storage engine. There are certain graphs here that a user has to consider to enable, because not in all situations that the variables are set correctly in the MySQL configuration.
-
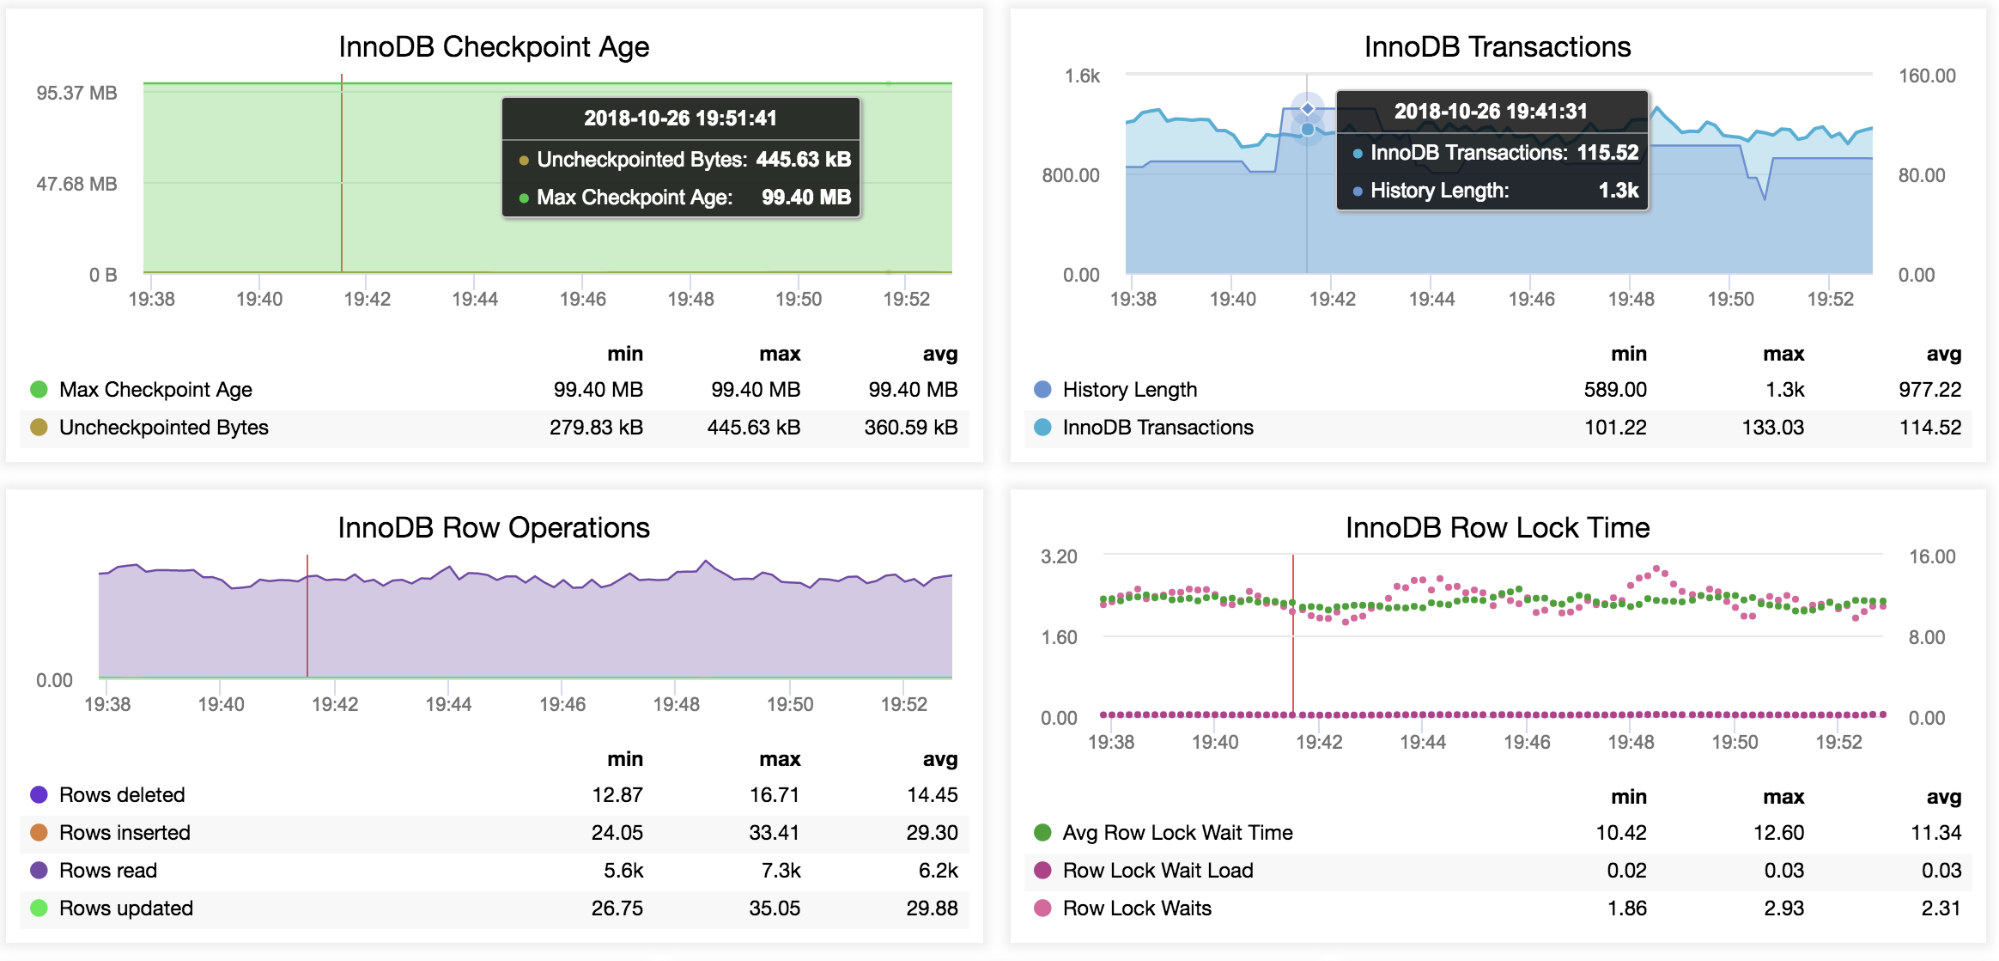
Innodb Checkpoint Age
According to the manual, checkpointing is defined as follows: “As changes are made to data pages that are cached in the buffer pool, those changes are written to the data files sometime later, a process known as flushing. The checkpoint is a record of the latest changes (represented by an LSN value) that have been successfully written to the data files”. This graph is useful when you would like to determine how your server is performing checkpointing data to your disk. This can be a good reference if your transaction log (redo log or ib_logfile0) is too large. This graph is also a good indicator if you need to adjust variables such as innodb_log_file_size,, innodb_log_buffer_size, innodb_max_dirty_pages_pct, or innodb_adaptive_flushing_method. The closer checkpoint age is to the max checkpoint age, the more filled are the logs and InnoDB will be doing more I/O in order to maintain some free space in the logs. Checkpointing mechanism differs in subtle details between Percona XtraDB-based flavours, MariaDB and Oracle’s version, you can also find differences in it’s implementation between MySQL versions.
-
InnoDB Transactions
Whenever there’s a large transaction on-going in your MySQL server, this graph is a good reference. It will count the transactions that were created at a specific time, and the history length (or is actually the history list length found in SHOW ENGINE INNODB STATUS) is the number of pages in the undo log. The trends you’ll see here is a good resource to check if it could mean, for example, that purge is delayed due to a very high insert rate of reloading the data or due to a long-running transaction, or if purge simply can’t keep up due to a high disk I/O in the volume where your $DATADIR resides.
-
Innodb Row Operations
For certain DBA tasks, you might want to determine the number of deletes, inserts, reads, and rows updated. Then this graph is what you can use to check these.
-
Innodb Row Lock Time
This graph is a good resource to look upon when you are noticing that your application is encountering lots of occurrences for “Lock wait timeout exceeded; try restarting transaction”. This can also help you determine if you might have an indication for using bad queries on handling locks. This is also a good reference to look upon when optimizing your queries that involves locking of rows. If the time to wait is too high, you need to check the slow query log or run a pt-query-digest and see what are those suspecting queries causing that bloat in the graph.
-
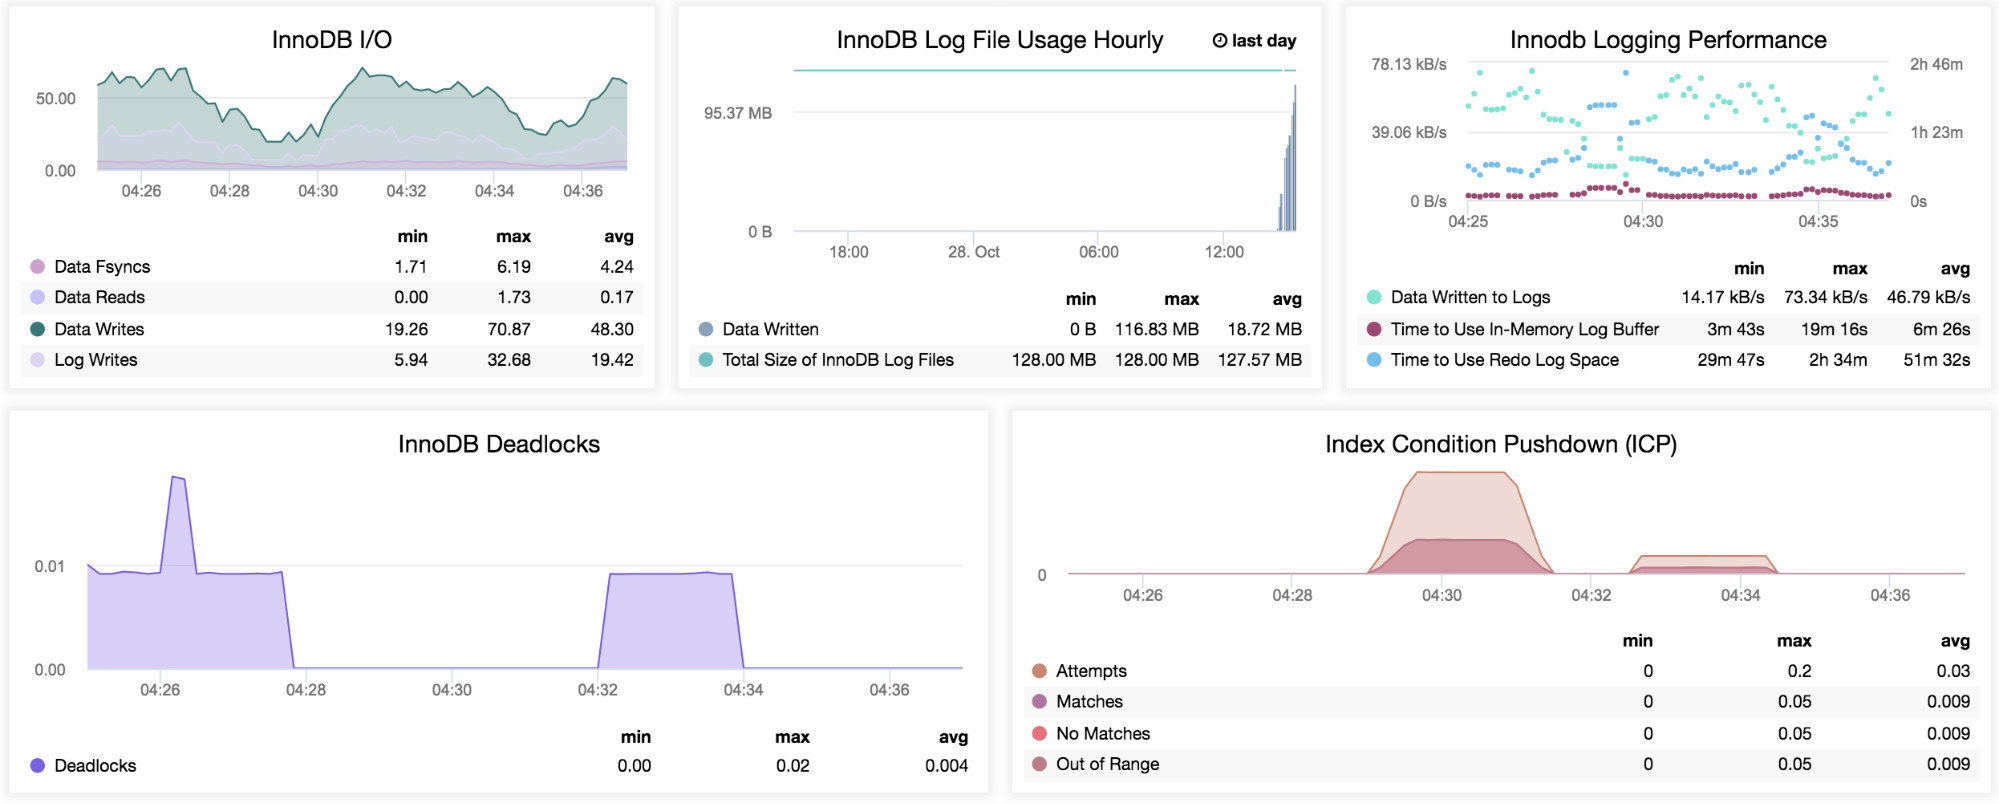
InnoDB I/O
Whenever you want to determine the amount of InnoDB data reads, disk flushes, writes, and log writes, this graph has what you need to look at. You can use this graph to determine if your InnoDB variables are well tuned to handle your specific requirements. For example, if you have Battery Backup Module cache but you are not gaining much of its optimum performance, you can rely on this graph to determine if your fsyncs() are higher than expected. Then changing the variable innodb_flush_method and using O_DSYNC can resolve the issue.
-
InnoDB Log File Usage Hourly
This graph shows only the number of bytes written to the InnoDB redo log files and the growth of your InnoDB log files based on the 24-hour time range of the current date.
-
InnoDB Logging Performance
This graph is closely related to InnoDB Log File Usage Hourly graph. You have to use this graph whenever you need to determine how large your innodb_log_file_size needs to be. You can determine the number of bytes written to the InnoDB redo log files and how efficiently your MySQL flushes data from memory to disk. Whenever you are experiencing a low-time in need to use your redo log space, then it would indicate that you have to increase your innodb_log_file size. In that case, this graph would tell you that you need to do so. However, to dig more into how much you need for your innodb_log_file, it might make more sense to check the LSN (Log Sequence Number) in SHOW ENGINE INNODB STATUS. Percona has a good blog related to this which is a good source to look at.
-
InnoDB Deadlocks
In certain situations that your application client is often experiencing deadlocks or you have to look at how much your MySQL is experiencing deadlocks, this graph serves the purpose. Deadlocks indicate that you have poor SQL design which leads to your transactions creating a race condition causing deadlocks.
-
Index Condition Pushdown
A little word of caution when looking at this graph. First, you have to determine that you have your MySQL global variable innodb_monitor_enable set to the correct value that is module_icp. Otherwise, you’ll experience a “No Data Points” as shown below:
The graph’s purpose, if has data points defined as what I have in the sample outputs, will provide a DBA with an overlook of how well your queries are benefiting with Index Condition Pushdown or ICP for short. ICP is great feature in MySQL that offers optimization to your queries. Instead of MySQL reading the full rows filtered in your WHERE queries upon retrieval, it will add more checks after your secondary indexes. This adds more granularity and saves time, otherwise the engine has to read the full-table rows instead when it is based only on the filtered index and no ICP is used. This avoids reading the full rows corresponding to your index tuples that matches your secondary indexes.
Let me elaborate a bit about this graph, let say I have a table named:
mysql> show create table aG
*************************** 1. row ***************************
       Table: a
Create Table: CREATE TABLE `a` (
  `id` int(11) NOT NULL,
  `age` int(11) NOT NULL,
  KEY `id` (`id`)
) ENGINE=InnoDB DEFAULT CHARSET=latin1
1 row in set (0.00 sec)
And has some small data:
mysql> select * from a;
+----+-----+
| id | age |
+----+-----+
|  1 |   1 |
|  2 |   1 |
|  3 |   1 |
|  3 |  41 |
|  4 |  41 |
|  5 |   4 |
|  4 |   4 |
|  4 |   4 |
+----+-----+
8 rows in set (0.00 sec)
When ICP is enabled, results is more efficient and feasible:
mysql> explain extended select * from a where id>2 and id<4 and age=41;
+----+-------------+-------+------------+-------+---------------+------+---------+------+------+----------+------------------------------------+
| id | select_type | table | partitions | type  | possible_keys | key  | key_len | ref  | rows | filtered | Extra                              |
+----+-------------+-------+------------+-------+---------------+------+---------+------+------+----------+------------------------------------+
|  1 | SIMPLE      | a     | NULL       | range | id            | id   | 4       | NULL |    2 |    12.50 | Using index condition; Using where |
+----+-------------+-------+------------+-------+---------------+------+---------+------+------+----------+------------------------------------+
1 row in set, 2 warnings (0.00 sec)
Than without ICP,
mysql> set optimizer_switch='index_condition_pushdown=off';
Query OK, 0 rows affected (0.00 sec)

mysql> explain extended select * from a where id>2 and id<4 and age=41;
+----+-------------+-------+------------+-------+---------------+------+---------+------+------+----------+-------------+
| id | select_type | table | partitions | type  | possible_keys | key  | key_len | ref  | rows | filtered | Extra       |
+----+-------------+-------+------------+-------+---------------+------+---------+------+------+----------+-------------+
|  1 | SIMPLE      | a     | NULL       | range | id            | id   | 4       | NULL |    2 |    12.50 | Using where |
+----+-------------+-------+------------+-------+---------------+------+---------+------+------+----------+-------------+
1 row in set, 2 warnings (0.00 sec)
This is a simple example of ICP, and how this graph can benefit a DBA.
-
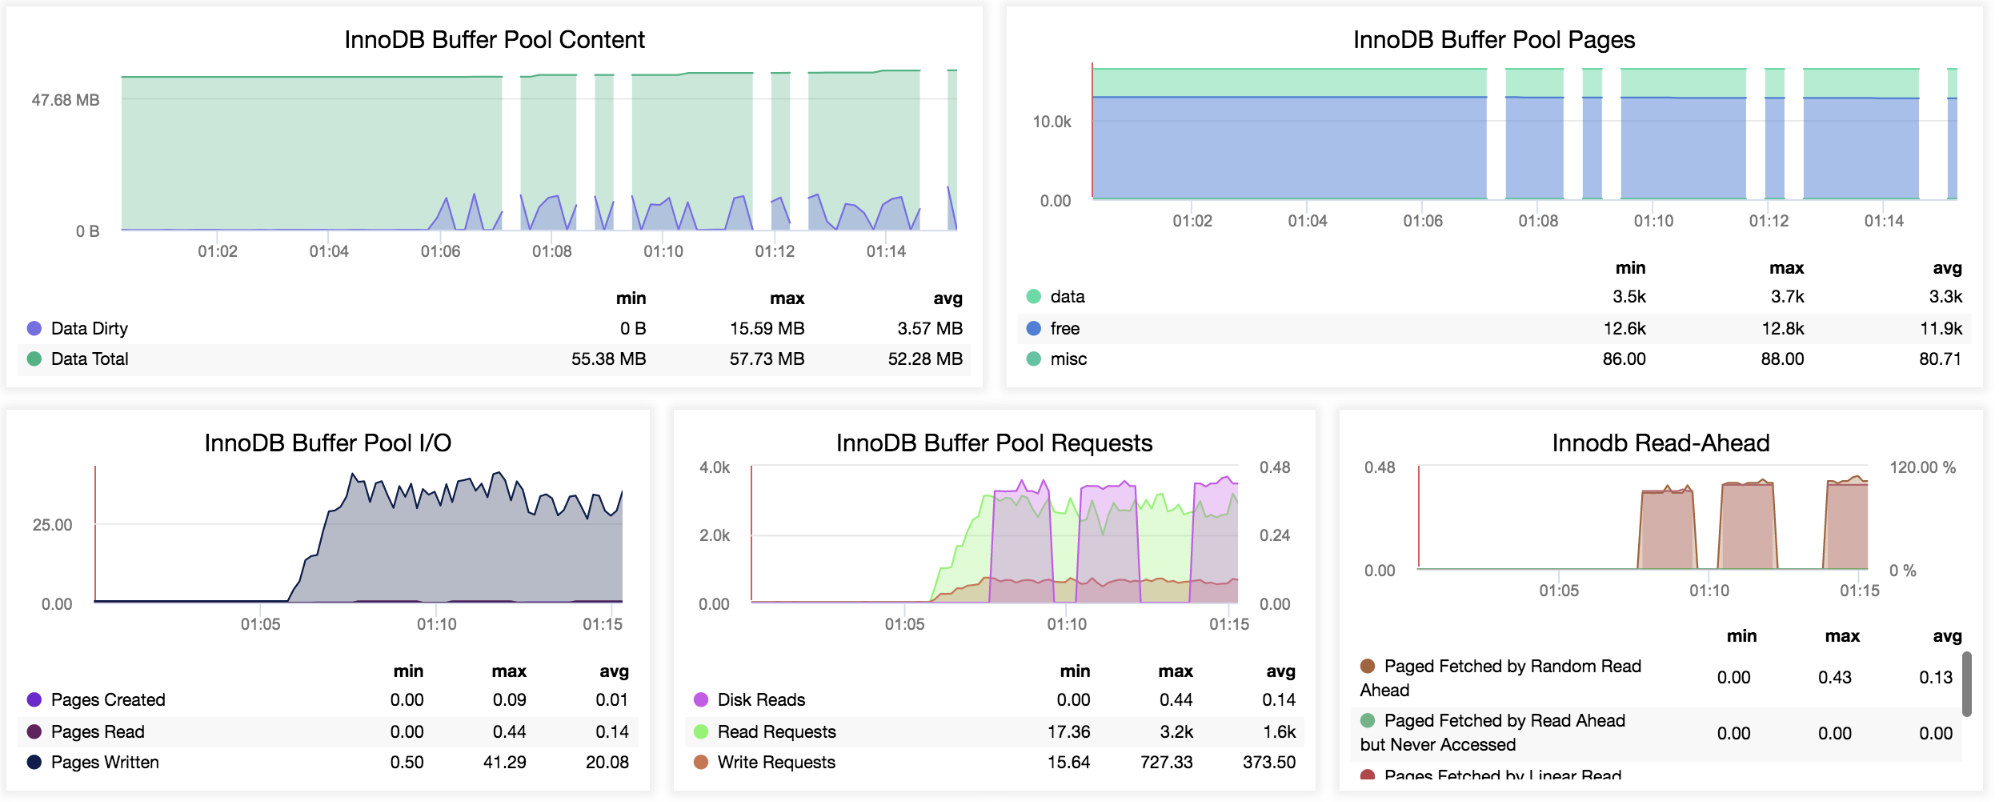
InnoDB Buffer Pool Content
When working with MySQL and using InnoDB engine, this graph is one of the most common values (innodb_buffer_pool*) that you have to tune up to optimize MySQL performance. Specifically speaking on its buffer pool content, it displays the trends for dirty pages against the total buffer pool content. The total buffer pool content includes the clean pages aside of dirty pages. Determining how efficient your MySQL is handling the buffer pool, this graph serves its purpose.
-
InnoDB Buffer Pool Pages
This graph is helpful when you want to check how efficient MySQL is using your InnoDB buffer pool. You can use this graph, for instance, if your daily traffic doesn’t fill up the assigned innodb_buffer_pool_size, then this could indicate that certain parts of an application aren’t useful or do not serve any purpose or if you set the innodb_buffer_pool_size very high which might be good to lower the value and reclaim back space to your memory.
-
InnoDB Buffer Pool I/O
When you have to check the number of pages created and written on InnoDB tables or page reads to InnoDB buffer pool by operations on InnoDB tables.
-
InnoDB Buffer Pool Requests
When you want to determine how efficiently are your queries are accessing the InnoDB buffer pool, this graph serves the purpose. This graph will show the trends based on the data points on how your MySQL server performs when InnoDB engine has to frequently access the disk (indication of buffer pool has not warmed up yet), how frequent the buffer pool requests were handling read requests and write requests.
-
InnoDB Read-Ahead
When you have the variable innodb_random_read_ahead set to ON, then add this graph as a valuable trend to look at as part of your DBA routine. It shows the trends on how your MySQL InnoDB storage engine manages the buffer pool by the read-ahead background thread, how it manages those subsequently evicted without having been accessed by queries, and how does InnoDB initiate the random read-ahead when a query scans a large portion of a table but in random order.
-
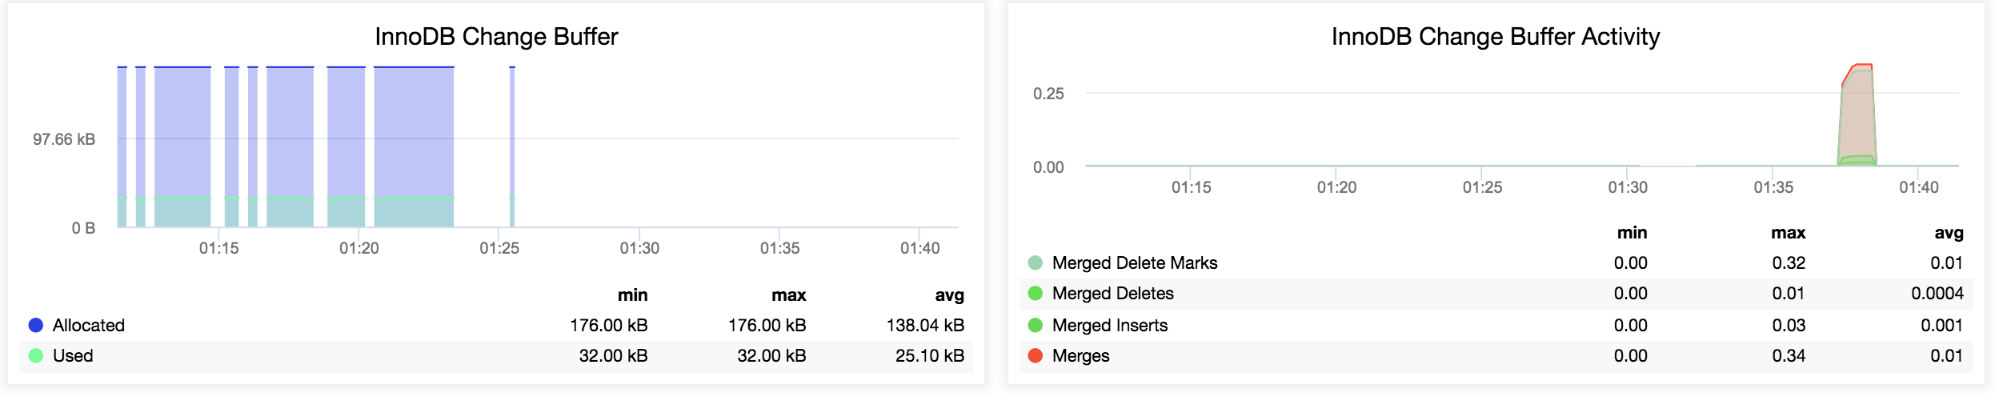
InnoDB Change Buffer
When you have Percona Server 5.7 running, this graph is useful when monitoring how well InnoDB has allocated change buffering. This changes includes those inserts, updates, and deletes which are specified by innodb_change_buffering variable. Change buffering helps speed up queries, avoiding substantial random access I/O that would be required to read-in secondary index pages from disk.
-
InnoDB Change Buffer Activity
This is related to the InnoDB Change Buffer graph, but dissects the information into more viable data points. These provide more information to monitor how InnoDB handles change buffering. This is useful in a particular DBA task to determine if your innodb_change_buffer_max_size is set to a too high value, since the change buffering shares the same memory of the InnoDB buffer pool reducing the memory available to cache data pages. You might have to consider to disable change buffering if the working set almost fits in the buffer pool, or if your tables have relatively few secondary indexes. Remember that change buffering does not impose extra overhead, because it only applies to pages that are not in the buffer pool. This graph is also useful if you have to determine how merges are useful if you do have to benchmark your application based on certain requests for particular scenarios. Let say you have a bulk inserts, you have to set innodb_change_buffering=insert and determine if having the values set in your buffer pool and innodb_change_buffer_max_size do not impact disk I/O, specially during recovery or slow shutdown (necessary if you want to do a failover with low downtime requirement). Also, this graph can serve your purpose to evaluate certain scenarios, since merging of change buffer may take several hours when there are numerous secondary indexes to update and many affected rows. During this time, disk I/O is increased, which can cause a significant slowdown for disk-bound queries.
MySQL Performance Schema
The MySQL Performance Schema is a complicated topic. It’s a long and hard one, but I’m going to discuss only information that is specific to the graphs we have in SCUMM. There are certain variables as well that you must consider, and ensure they are set properly. Ensure that you have your variable innodb_monitor_enable = all and userstat=1 to see data points in your graphs. As a note, when I am using the word “event” here, it does not mean that this is related to MySQL Event Scheduler. I’m talking about specific events such as MySQL parses a query, MySQL is reading or writing to relay/binary log file, etc.
Let’s proceed with the graphs then.
-
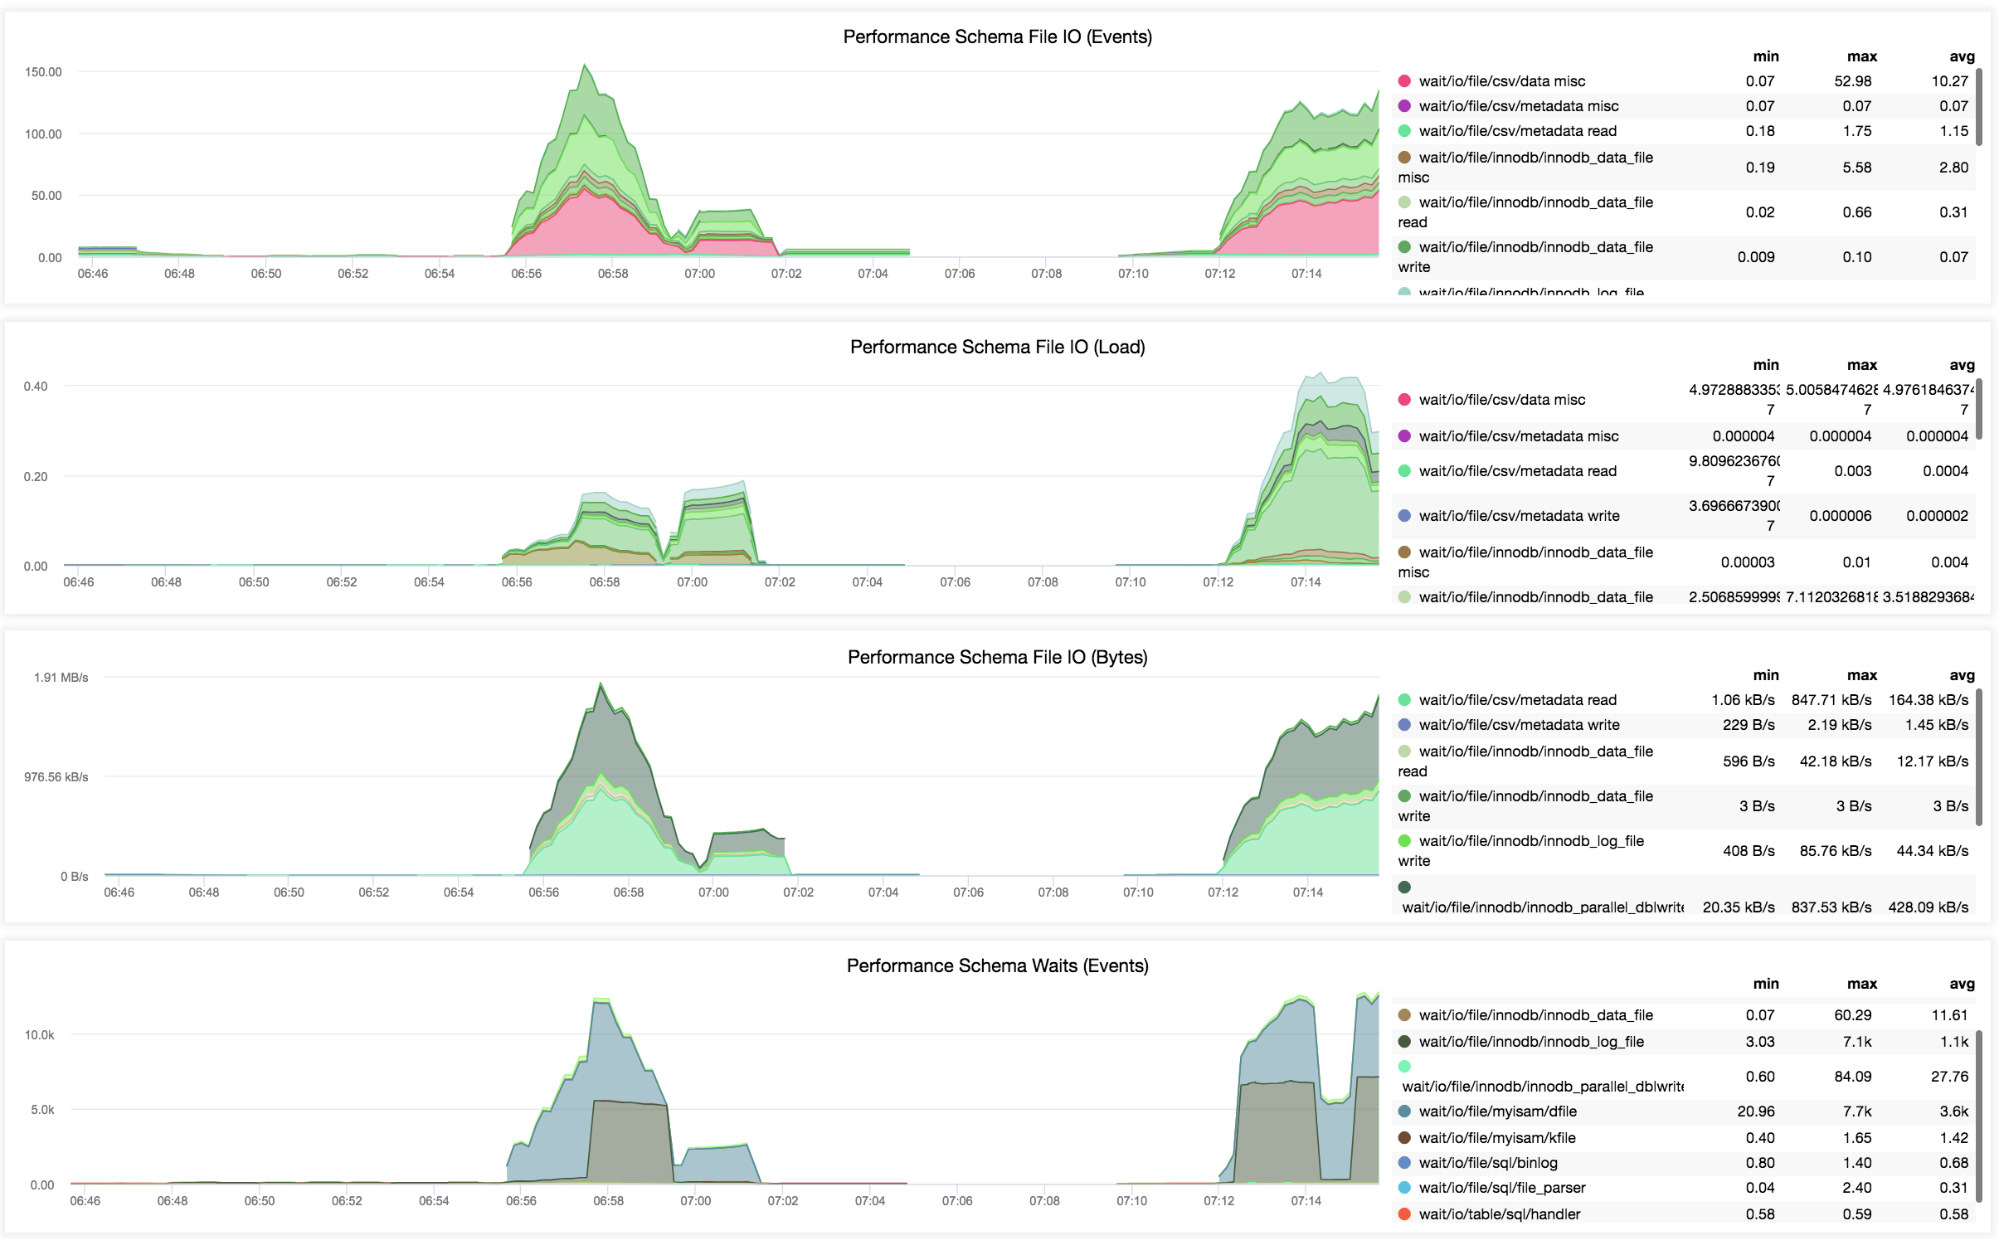
Performance Schema File IO (Events)
This graph fetches data points related to any events that occurred in MySQL which might have been instrumented to create multiple instances of the instrumented object (e.g. binary log reads or InnoDB data file reads). Each row summarizes events for a given event name. For example, if there is an instrument for a mutex that is created for each connection, then there could be many instances of this instrumented event as there are multiple connections. The summary row for the instrument summarizes over all these instances. You can check these events in MySQL manual for Performance Schema Summary Tables for more info.
-
Performance Schema File IO (Load)
This graph is same as “Performance Schema File IO (Events)” graph except that it’s instrumented based on the load.
-
Performance Schema File IO (Bytes)
This graph is same as “Performance Schema File IO (Events)” graph except that it’s instrumented based on the the size in bytes. For example, how much time did a specific event take when MySQL triggered wait/io/file/innodb/innodb_data_file event.
-
Performance Schema Waits (Events)
This graph has the data graph for all waits spent on a specific event. You can check Wait Event Summary Tables in the manual for more info.
-
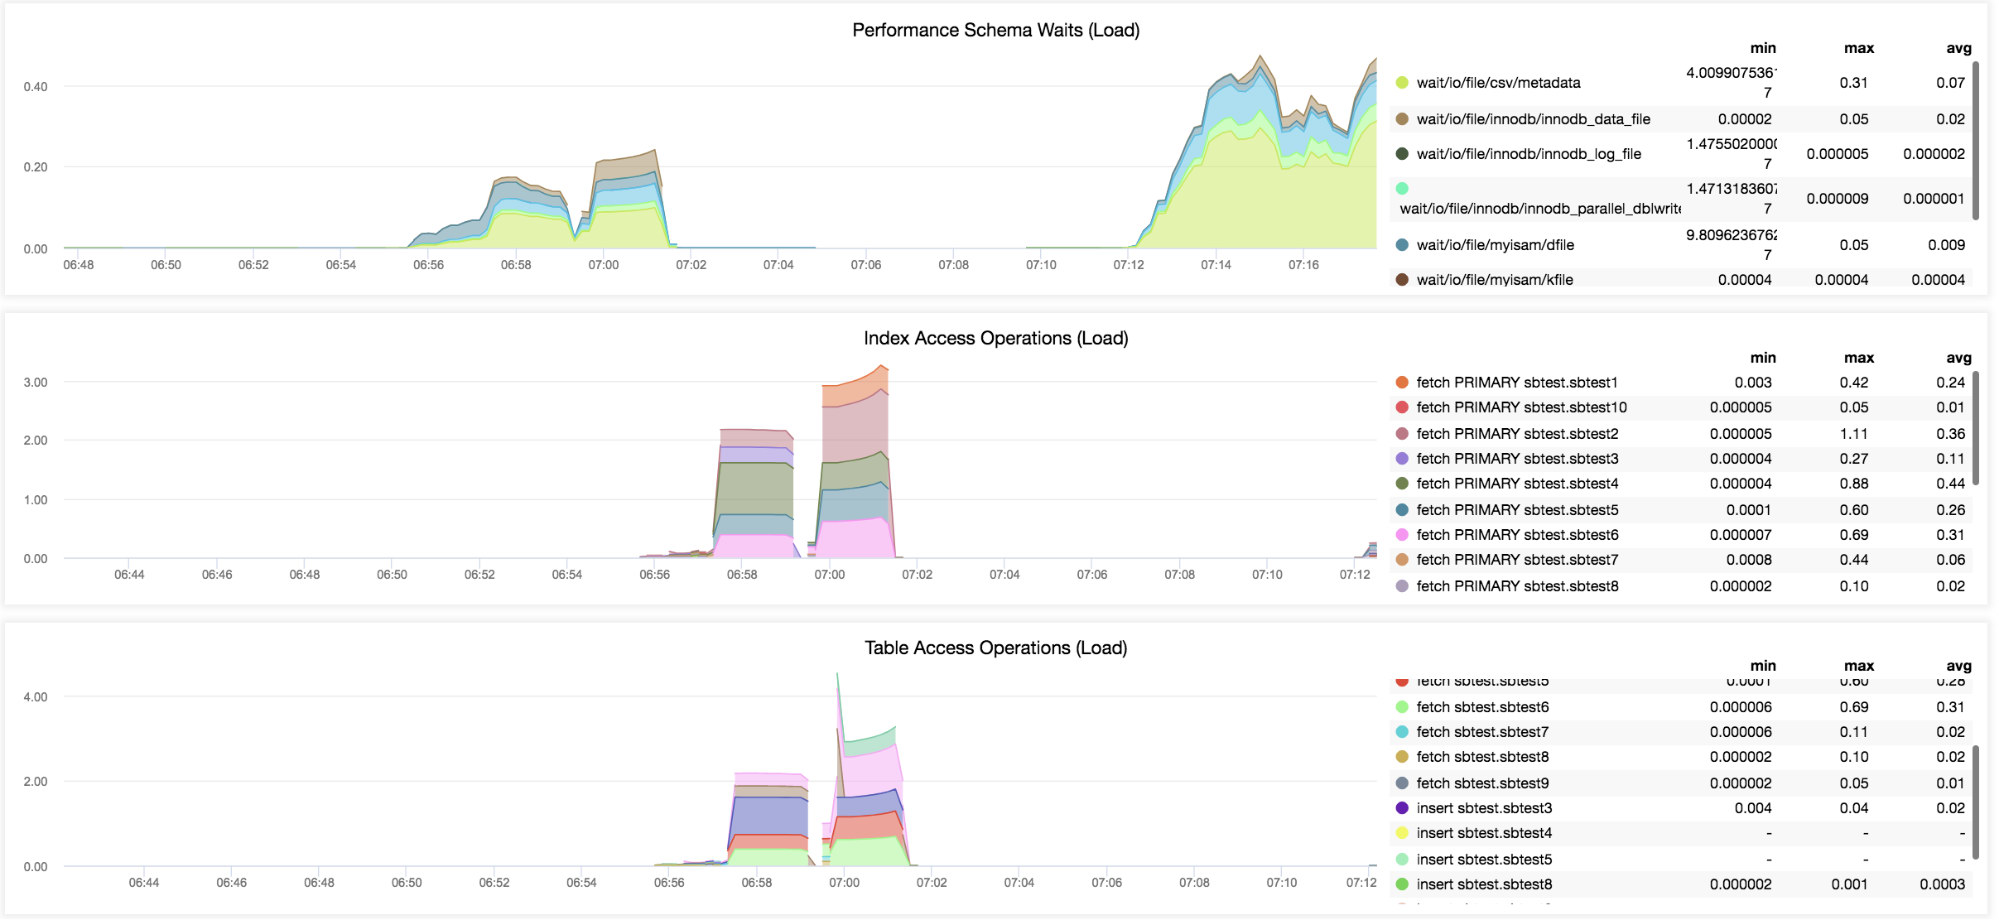
Performance Schema Waits (Load)
Same as the “Performance Schema Waits (Events)” graph but this time it shows the trends for the load.
-
Index Access Operations (Load)
This graph is an aggregation of all the table index I/O wait events grouped by index(es) of a table, as generated by the wait/io/table/sql/handler instrument. You can check the MySQL manual about the Performance Schema table table_io_waits_summary_by_index_usage for more info.
-
Table Access Operations (Load)
“Same as Index Access Operations (Load)” graph, it’s an aggregation of all table I/O wait events group by table, as generated by the wait/io/table/sql/handler instrument. This is very useful to DBAs. For example, you would like to trace how fast it takes to access (fetch) or update (insert, delete, update) a specific table. You can check in the MySQL manual about the Performance Schema table table_io_waits_summary_by_table for more info.
-
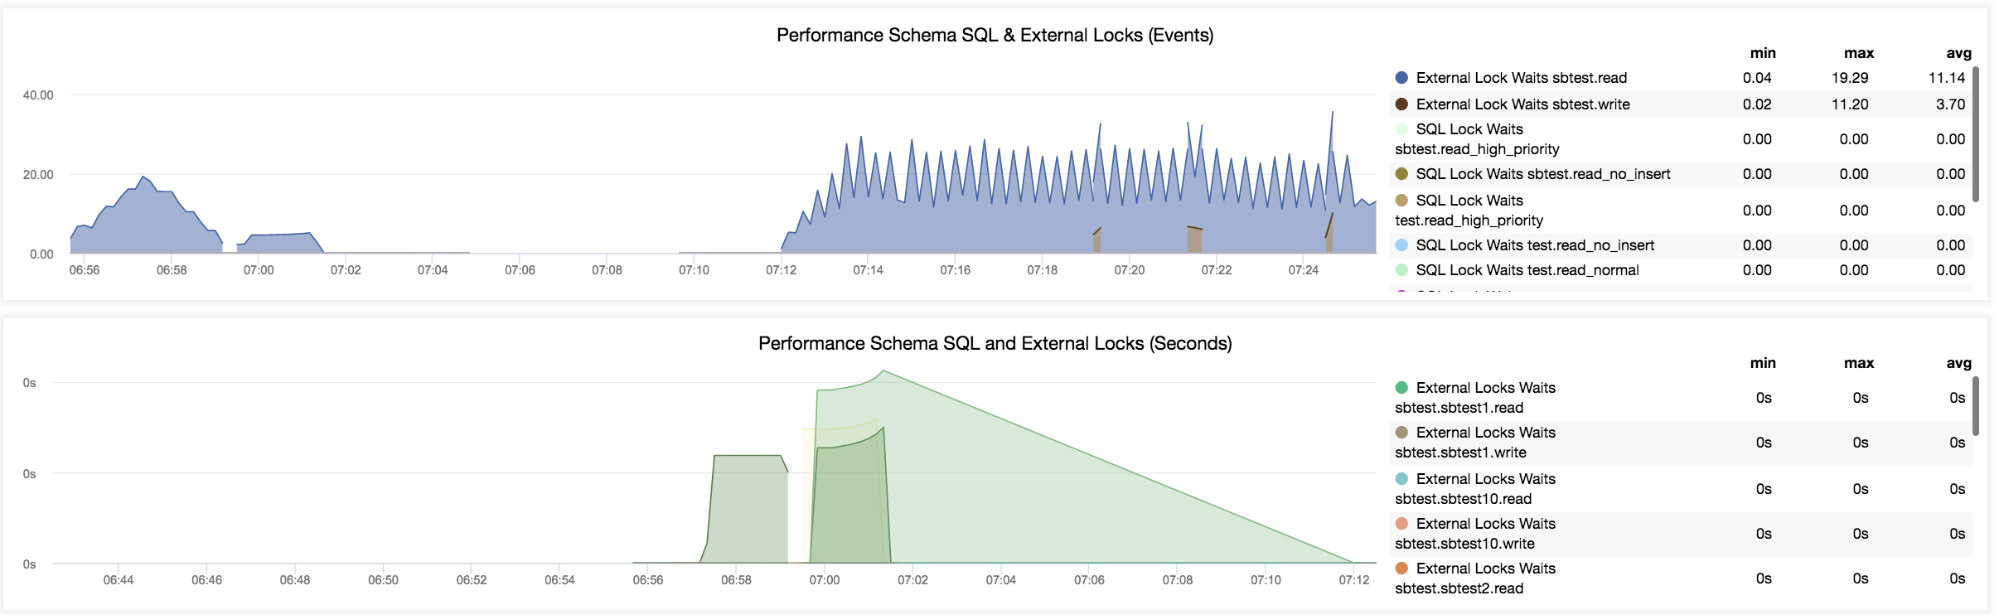
Performance Schema SQL & External Locks (Events)
This graph is an aggregation (counts of how many times it occured) of all table lock wait events, as generated by the wait/lock/table/sql/handler instrument which is group by table. The SQL lock here in the graph means of the internal locks. These internal locks are read normal, read with shared locks, read high priority, read no insert, write allow write, write concurrent insert, write delayed, write low priority, write normal. While the external locks are read external and write external. In any DBA task, this is very useful if you have to trace and investigate locks on a particular table regardless of its type. You can check the table table_lock_waits_summary_by_table for more info.
-
Performance Schema SQL and External Locks (Seconds)
Same as graph “Performance Schema SQL & External Locks (Events)”, but specified in seconds. If you want to look for your table locks based on seconds it held the locks, then this graph is your good resource.
Conclusion
The InnoDB Metrics and MySQL Performance Schema are some of the most in-depth and complicated parts in the MySQL domain, especially when there is no visualization to assist the interpretation. Thus, going to a manual trace and investigations may take some of your time and hard work. SCUMM dashboards offer a very efficient and feasible way to handle these and lower the extra load on any DBA routine task.
In this blog, you learnt how to use the dashboards for InnoDB and Performance Schema to improve database performance. These dashboards can make you more efficient at analyzing performance.