blog
MySQL Query Performance Tuning

Bad query performance is the most common problem DBA’s have to deal with. There are numerous ways to collect, process and analyze the data related to query performance – we’ve covered one of the most popular tools, pt-query-digest, in some of our previous blog posts:
Become a MySQL DBA blog series
- Analyzing your SQL Workload using pt-query-digest
- Deep Dive SQL Workload Analysis using pt-query-digest
When you use ClusterControl though, this is not always needed. You can use the data available in ClusterControl to solve your problem. In this blog post, we’ll look into how ClusterControl can help you solve problems related to query performance.
It may happen that a query cannot complete in a timely manner. The query may be stuck due to some locking issues, it may be not optimal or not indexed properly or it may be too heavy to complete in a reasonable amount of time. Keep in mind that a couple of not indexed joins can easily scan billions of rows if you have a large production database. Whatever happened, the query is probably using some of the resources – be it CPU or I/O for a non-optimized query or even just row locks. Those resources are required also for other queries and it may seriously slows things down. One of very simple yet important tasks would be to pinpoint the offending query and stop it.
It is pretty easily done from the ClusterControl interface. Go to the Query Monitor tab -> Running Queries section – you should see an output similar to the screenshot below.
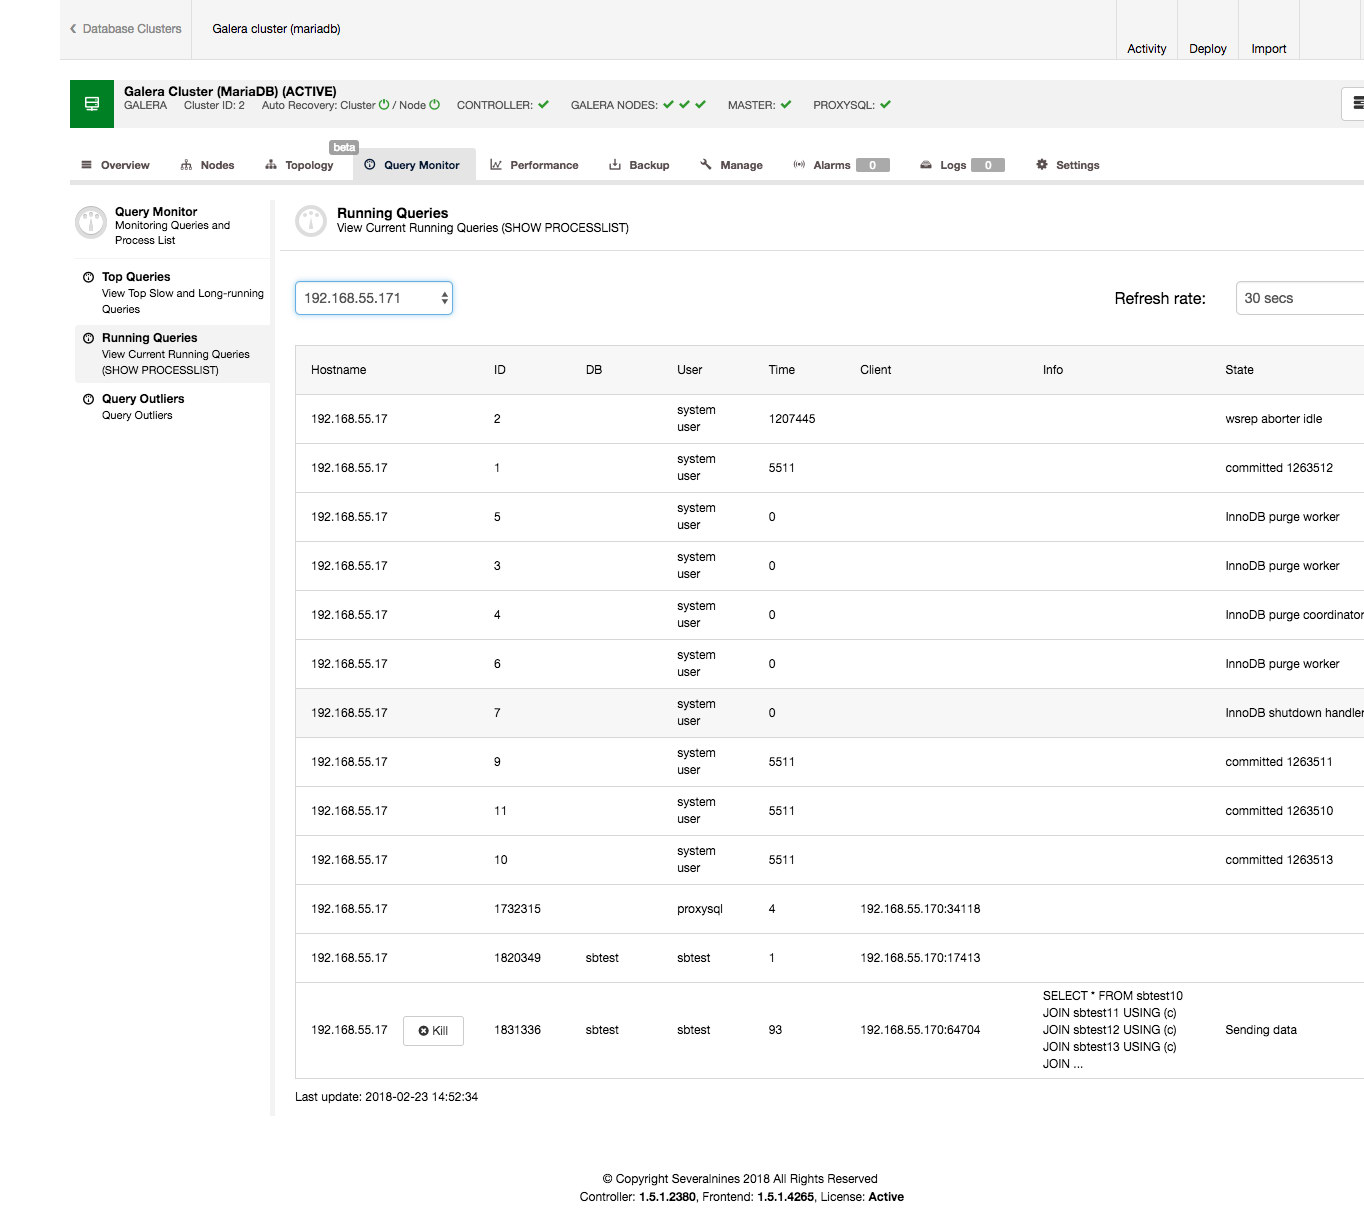
As you can see, we have a pile of queries stuck. Usually the offending query is the one which takes the long time, you might want to kill it. You may also want to investigate it further to make sure you pick the correct one. In our case, we clearly see a SELECT … FOR UPDATE which joins a couple of tables and which is in the ‘Sending data’ state meaning it is processing the data, for last 90 seconds.
Another type of question a DBA may need to answer is – which queries take most time to execute? This is a common question, as such queries may be a low hanging fruit – they may be optimizable, and the more execution time a given query is responsible for in a whole query mix, the larger is the gain from its optimization. It is a simple equation – if a query is responsible for 50% of total execution time, making it 10x faster will give much better result than optimizing a query which is responsible for just 1% of the total execution time.
ClusterControl can help you answer such questions, but first we need to ensure the Query Monitor is enabled. You can toggle the Query Monitor to ON under the Query Monitor page. Furthermore you can configure the “Long Query Time” and “Log queries not using indexes” option under Settings to suit your workload:
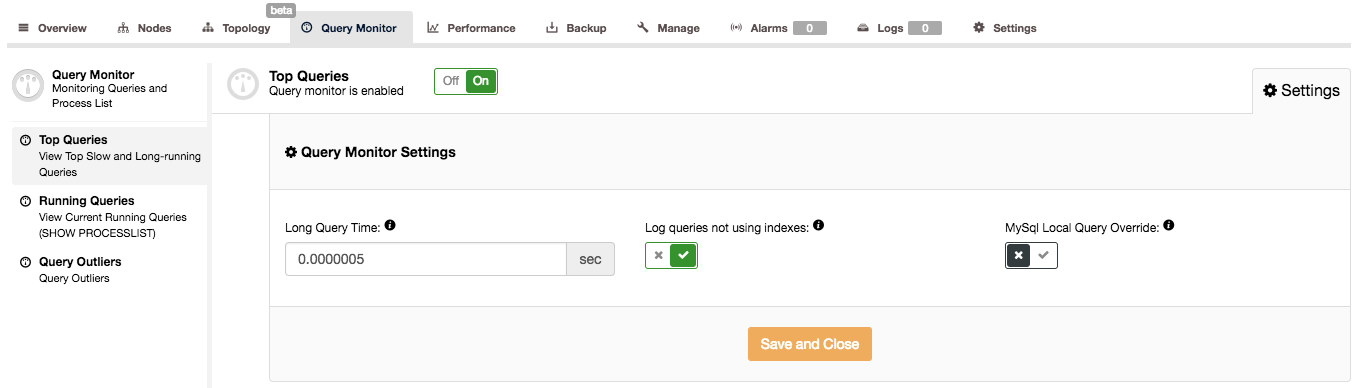
The Query Monitor in ClusterControl works in two modes, depending on whether you have the Performance Schema available with the required data on the running queries or not. If it is available (and this is true by default in MySQL 5.6 and newer), Performance Schema will be used to collect query data, minimizing the impact on the system. Otherwise, the slow query log will be used and all of the settings visible in the above screenshot are used. Those are pretty well explained in the UI, so there’s no need to do it here. When the Query Monitor uses Performance Schema, those settings are not used (except for toggling ON/OFF the Query Monitor to enable/disable data collection).
When you confirmed that the Query Monitor is enabled in ClusterControl, you can go to Query Monitor -> Top Queries, where you’ll be presented with a screen similar to the below:
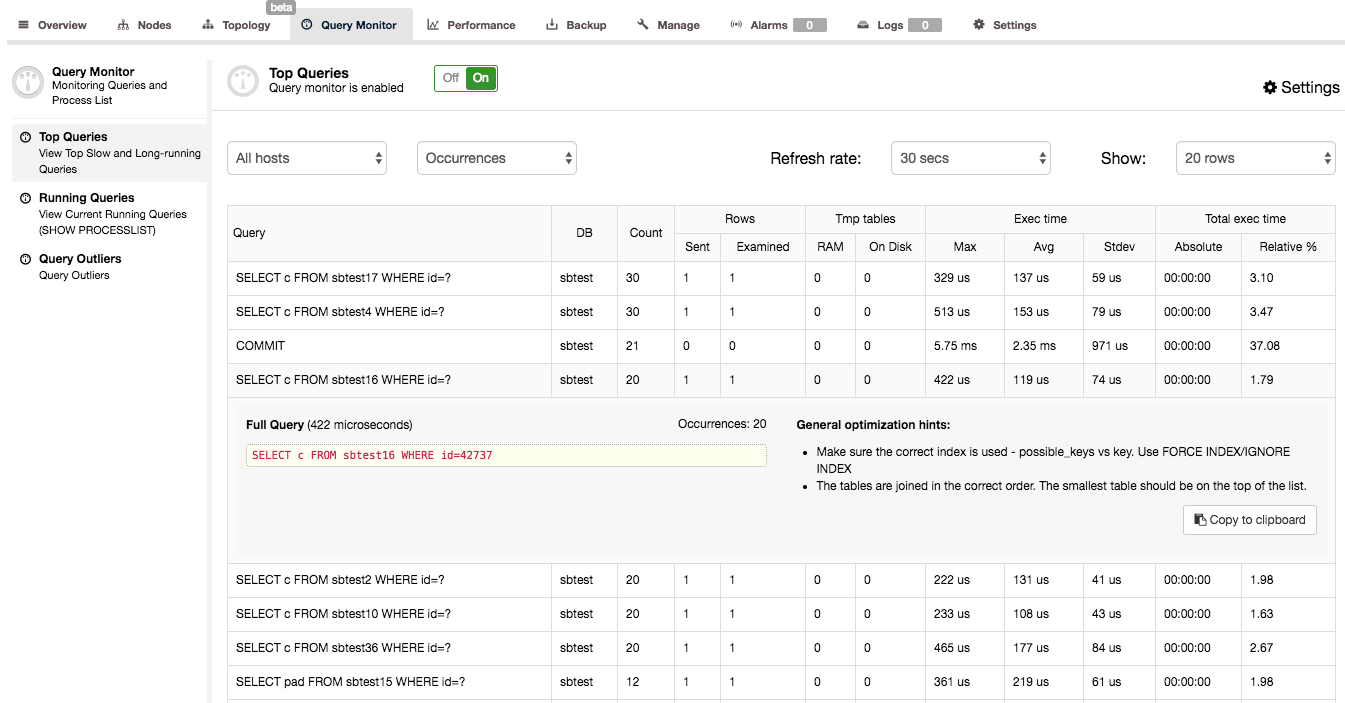
What you can see here is a list of the most expensive queries (in terms of execution time) that hit our cluster. Each of them has some further details – how many times it was executed, how many rows were examined or sent to the client, how execution time varied, how much time the cluster spent on executing a given type of query. Queries are grouped by query type and schema.
You may be surprised to find out that the main place where execution time is spent is a ‘COMMIT’ query. Actually, this is fairly typical for quick OLTP queries executed on Galera cluster. Committing a transaction is an expensive process because certification has to happen. This leads to COMMIT being one of the most time-consuming queries in the query mix.
When you click on a query, you can see the full query, maximum execution time, number of occurrences, some general optimization hints and an EXPLAIN output for it – pretty useful to identify if something’s wrong with it. In our example we’ve checked a SELECT … FOR UPDATE with a high number of rows examined. As expected, this query is an example of terrible SQL – a JOIN which does not use any index. You can see on the EXPLAIN output that no index is used, not a single one was even considered possible to use. No wonder this query seriously impacted the performance of our cluster.
Another way to get some insight into query performance is to look at Query Monitor -> Query Outliers. This basically is a list of queries whose performance significantly differ from their average.
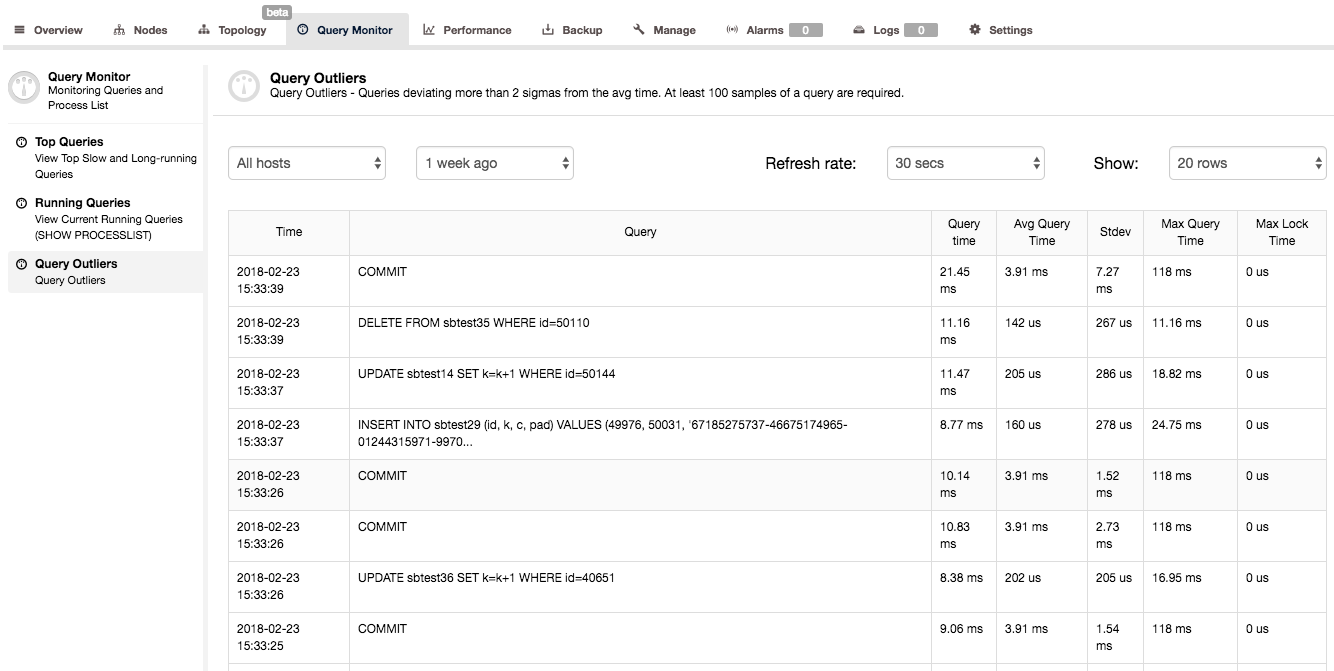
As you can see in the above screenshot, the second query took 0.01116s (time is shown in milliseconds) where average execution time for that query is much lower (0.000142s). We have also some additional statistical info on standard deviation and maximum query execution time. Such list of queries may seem to be not very useful – it’s not really true. When you see a query on this list, it means that something was different from the usual – query did not complete in regular time. It may be an indication of some performance issues on your system and a signal that you should investigate other metrics, and check if anything else happened at that time.
People tend to focus on achieving max performance, forgetting that it is not enough to have high throughput – it also has to be consistent. Users like performance to be stable – you may be able to squeeze more transactions per second from your system but if it means that some transactions will start to stall for seconds, that’s not worth it. Looking at the Query Histogram in ClusterControl helps you identify such consistency issues in your query mix.
Happy query monitoring!
PS.: To get started with ClusterControl, click here!